Rotation Trades, Election Vibes
Is it all one trade?

Author’s Note: I will continue releasing free content where I can provide value to everyone. Posts will include premium content for paid subscribers at the end of emails or as separate write-ups. Free content will focus on macro views, whereas the paid content will focus more on the tactical trades I’m making.
Serious traders or investors should join Premium to get the best, most timely information.
This past week was a bit of a strange one in the markets. There were many conflicting signals and chaotic price action, which ended with the indices closing up small. The exception there was the Russel which had a strong week.

We captured much of that Russel upside as I spotted the emerging trend and noted it in Tuesday’s piece (link below). We put the trade on Wednesday morning.

Below is the ratio of NDX:RTY. It peaked in July (NDX dominance) before cratering into August 5th. We’ve been trading in a range ever since.
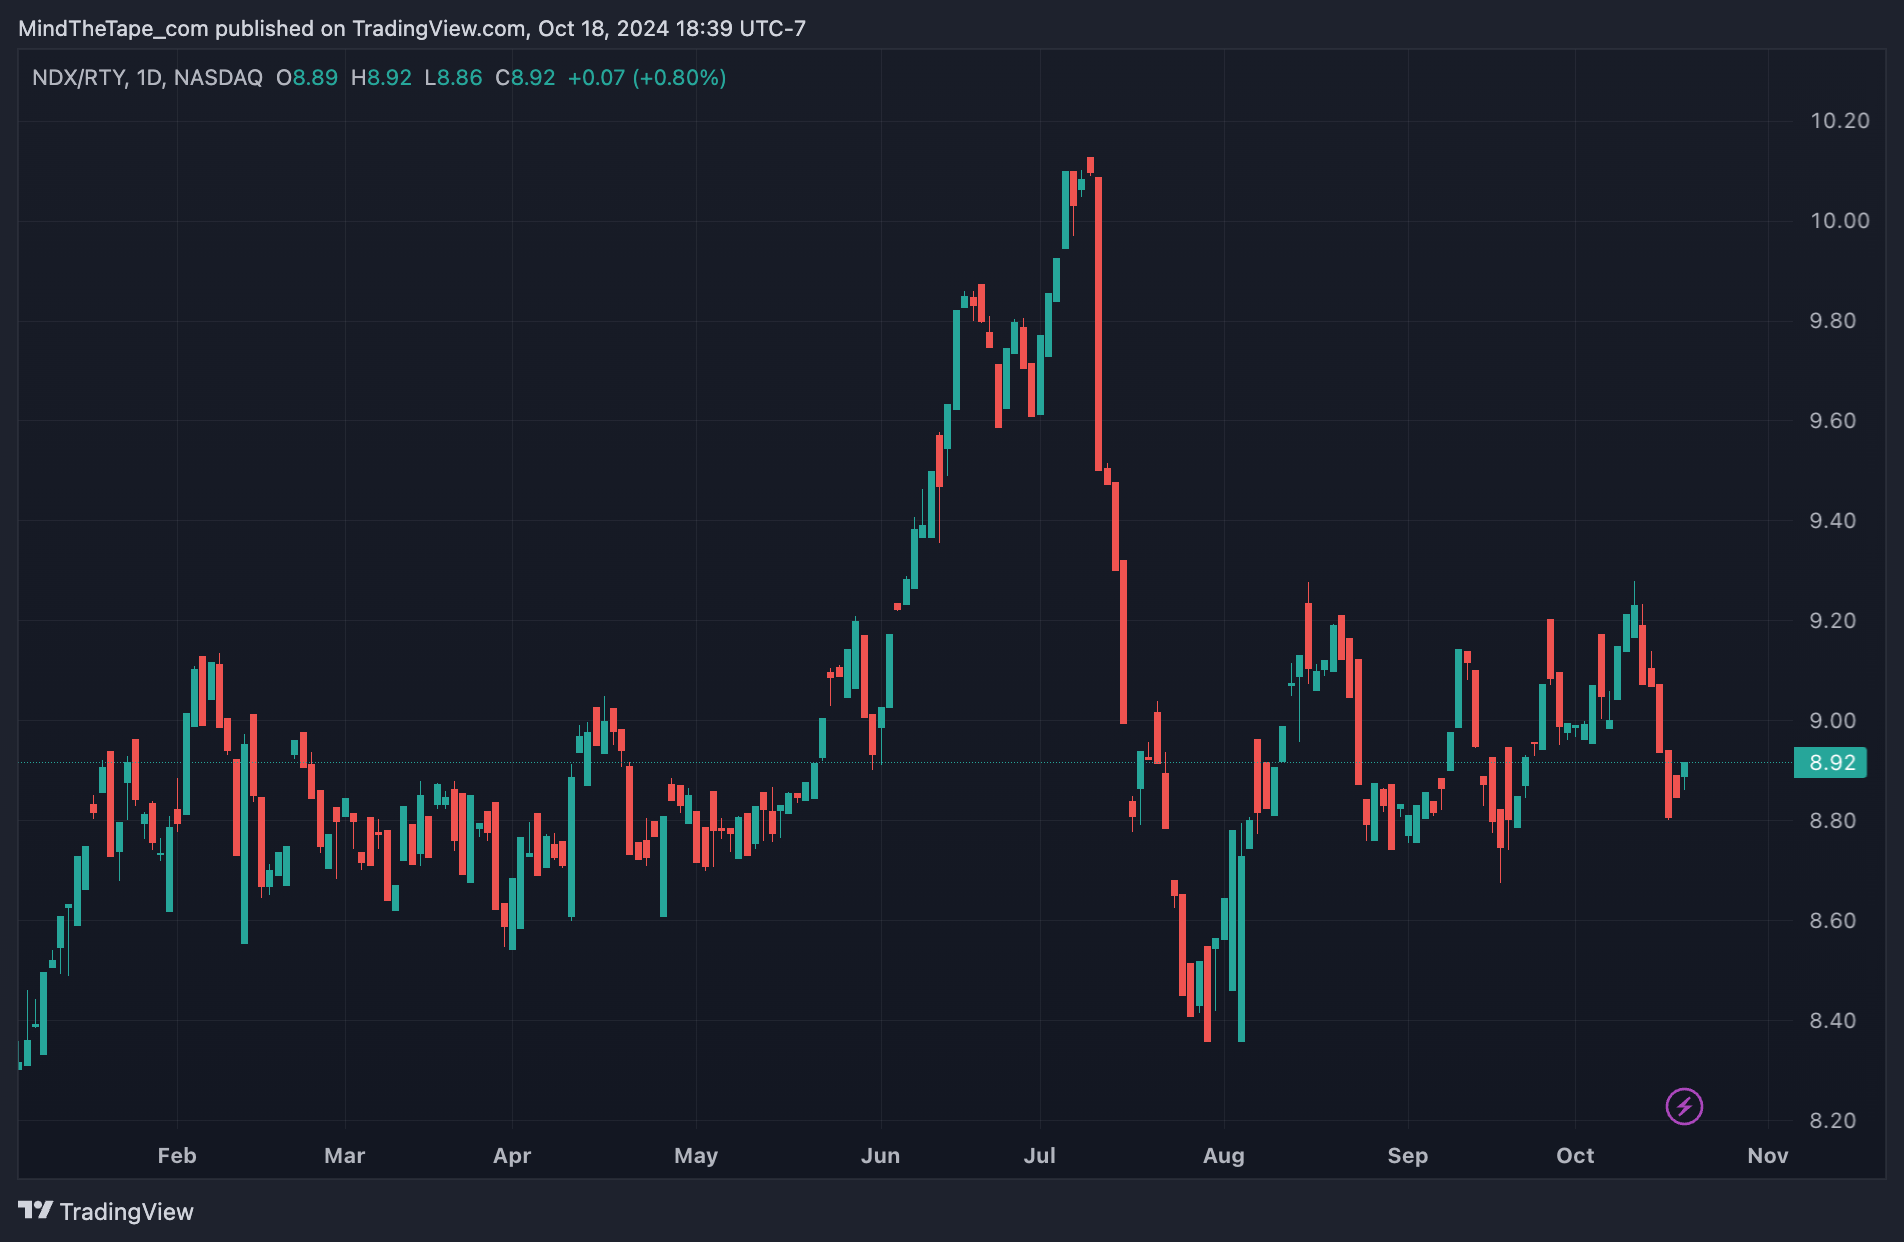
August 5th is a significant day because it was the day the violent carry trade unwind occurred. If you’re unfamiliar with what happened there, you can read about it below.
The Trades That Blew Up

If you enjoy this post, make sure to subscribe for free. Subscribers get all of my market analysis delivered directly in their inbox when it’s most relevant.
The longer-term trend here is also interesting. Here’s a chart of NDX:RTY stretching back to 1999.

Many people are looking at these two charts and saying, “It’s time for the small-cap trend to reverse.”
While we have added small-cap exposure, I think it’s vital to be wary of this narrative. Do you know why NDX is outperforming RTY so dramatically?
Because tech has been an earnings powerhouse and small-caps have not.
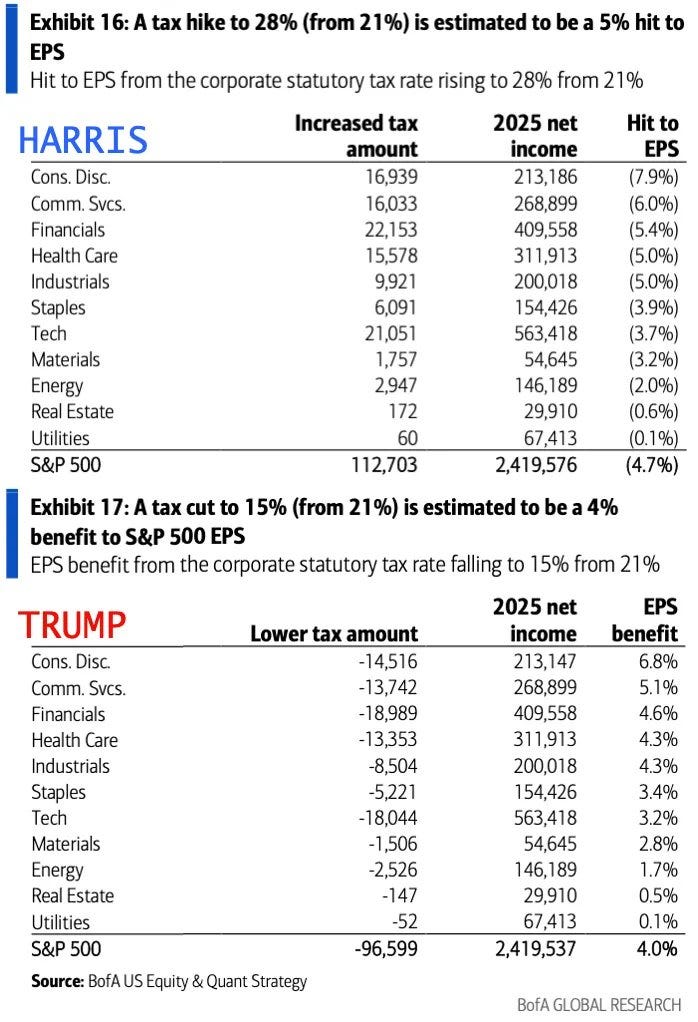
Below is a chart of the P/E ratio based on the last twelve months and the forward twelve-month expectations for each of the major indices.

Over this period, trailing P/E ratios are up:
10.59% for NDX
29.3% for SPX
57.83% for RTY
And forward-looking P/E ratios are up:
12.53% for NDX
22.39% for SPX
40.05% for RTY
That means that over the last twelve months, the market has already quietly but dramatically changed its mind about the Russel's prospects.
Partly, this is because we have priced out a recession, which would hit the Russel hardest.
Meanwhile, over that same period, the indices have tracked roughly equal returns.

I’m going to show you one more chart and then I’ll get to the point here. Let’s take a look at P/E ratios historically since 2003.

Unlike the chart of the relative performance of NDX:RTY, do any of these charts scream “I have to run out and buy RTY” to you?
They don’t to me. All three indexes are trading towards the higher end of their P/E ranges. Based on this period, you could argue that tech has become maybe 15-20% rich historically compared to RTY.
But shouldn’t it be?
Here’s the EPS growth of NDX vs. RTY.
The NDX has continued to astound with incredible prolonged growth.
All of this to say, I’m bullish on tech and skeptical of the small-cap rotation.
We won’t be bold like Citrini and put the direct short NQ or ES and long RTY trade on. But will we make sure we have both tech and small-cap exposure for now. When I think the coast is clear on small-caps sucking liquidity from NDX, I’m getting ready to load back up on tech names.

The NDX is looking to test its all-time highs. Over the next two weeks, earnings season and the election will likely see it blow through or fail and retrace.
My bet is we try for a breakout before the election. Let’s see.
The Trump Trades
The election is just a couple of weeks away. Trump’s surging odds have everyone talking about the Trump trades.
Bonds have been selling off aggressively. Long term readers will know that we’ve been short until very recently, when we took profit.

The chart above shows Trump’s odds (inverted) plotted against TLT. Note the correlation… as Trump’s odds to win have gone up, TLT has gone down.
Many people have argued that this is because Trump wants to undermine the Fed's independence. They’ve also argued that Trump will be more fiscally irresponsible than Harris.
We know that’s not the case. In fact, some serious analysis has indicated that Harris will be much worse for the fiscal situation than Trump. You can read a more detailed look at that below.

Bonds have gone down as Trump’s odds have gone up, and the reason is simple: Trump will be better for growth. The Fed will not cut as much under Trump, because it will not need to.
The counterargument to that is that Trump represents a higher long-run inflation risk.
However, one often overlooked thing is how his pro-oil policy can bring CPI down.
Drill, Baby, Drill

I’m not an oil expert, and I don’t trade oil. These numbers aren’t meant to be accurate estimates, they are just meant to be in the ballpark.
Oil is an input, in some form or another, for almost everything we consume on a daily basis. Bag of chips? Petroleum. Piece of fish? Petroleum. iPhone? Petroleum.
Trump has been a profoundly pro-energy candidate.
Using some very rough math, Trump might be able to improve domestic oil production by 1.5mm bbl/day during his administration. We might very roughly expect such a change to result in oil prices being about 10% lower.
It’s estimated that for every $10 the price of oil moves, CPI inflation rises or falls between .2-.4%.
In other words, Trump could single-handedly lower long-term CPI by .2-.4% with his oil policy.
Furthermore, Saudi Arabia and the United States might have quietly reached a long-term deal to keep oil prices low in exchange for resuming arms sales to Saudi.


This is all a recipe for much lower oil prices and correspondingly lower inflation.
Tariffs
People view Trump’s policy on tariffs as antiquated and misguided. They claim that his tariff policies will ignite inflation anew in the United States.
And they’re right, provided that we have to pay the tariffs. If Trump places tariffs on China, our great trade nemesis, we will have to pay tariffs on products from China.
However, the production of those items will move from places like China to places like Mexico, and that shift has already begun.
In 2019, the United States's total trade balance with China was $569b, and with Mexico, it was $501b.
Last year, that had flipped to $746b with Mexico and $595b with China. Expect this trend to continue with either Kamala or Trump.
Keep in mind we import almost $4 trillion worth of goods these days.
Right now, China is also in an incredibly vulnerable position regarding tariffs. Domestic demand is very low, and the country is more dependent on exports than ever.
That means China might be more willing to play ball on trade policy.
I’m sure there are some idiosyncratic opportunities surrounding tariffs, but the threat of them will not dramatically influence markets.
Election Trades
I am working on some thematic ideas about the election based on sectors that have responded well to the surges in each candidate's prospective chances of winning.
That post will come later, and there might be a special surprise with it.
For now, it’s wise to consider Trump more bullish equities than Kamala. Also, as I’ve outlined, I’d be cautious of claims that Trump will be the death of the bond market due to inflation.