
The Coming Macro MELTDOWN
Why everything feels like it's going to zero...


Is Japan the Weak Link in the Global Money Machine?
If you hang around macro Twitter or listen to podcasts like Macro Voices, you’ll hear people talk about things like global liquidity, carry trades, and the yen.
For most normal humans and even the average trader, that’s all pretty opaque.
But some of the people who watch this stuff closely—like
Michael Howell
of Global Liquidity Indexes—are starting to say something important:
The global “money machine” that has been pushing asset prices higher for years looks like it’s at or near its peak.
And one of the weakest spots in that machine is Japan.
In this post I’ll try to unpack that in plain English:
What “global liquidity” actually means
What the yen carry trade is, and why traders love it
What changed in Japan in 2024–25
And why this all matters for stocks, bonds, and the next big “risk‑off” event
First: what on earth is “global liquidity”?
Think of the financial system as a network of balance sheets: banks, hedge funds, dealers, pension funds, central banks.
Global liquidity is basically:
How much spare capacity there is across those balance sheets to buy assets, lend money, and take risk.
It’s not just “how low interest rates are.” It’s more like:
How many credit cards the system has
How high the limits are
And how willing people are to swipe them
In his November 2025 slide deck, Howell estimates that this “liquidity stock” is roughly:
US$185 trillion of global liquidity
Against about US$115 trillion of world GDP
So the pile of financial “risk capacity” is bigger than the annual output of the entire world economy.
He then breaks that US$185T into two big pieces:
A smaller slice of central‑bank money (the stuff we usually talk about when we say QE/QT)
A much larger slice of private‑sector liquidity and collateral. This counts all the bank lines, repos, FX swaps, shadow‑bank credit and so on that grease the system
Since 2008 w have become so used to counting central bank liquidity that we sometimes forget about the importance of this private-sector liquidity. That second piece is how markets can occasionally go wild even when central banks aren’t doing anything dramatic: most of the “juice” lives outside official balance sheets.
Where we are in the cycle
If you plot this global liquidity through time, you get waves: big ups and downs every few years.
In his charts, Howell shows that:
Liquidity fell sharply into 2022 (think rate hikes and QT),
Then surged back through 2023–24,
And by 2025 has stopped accelerating and begun to roll over.
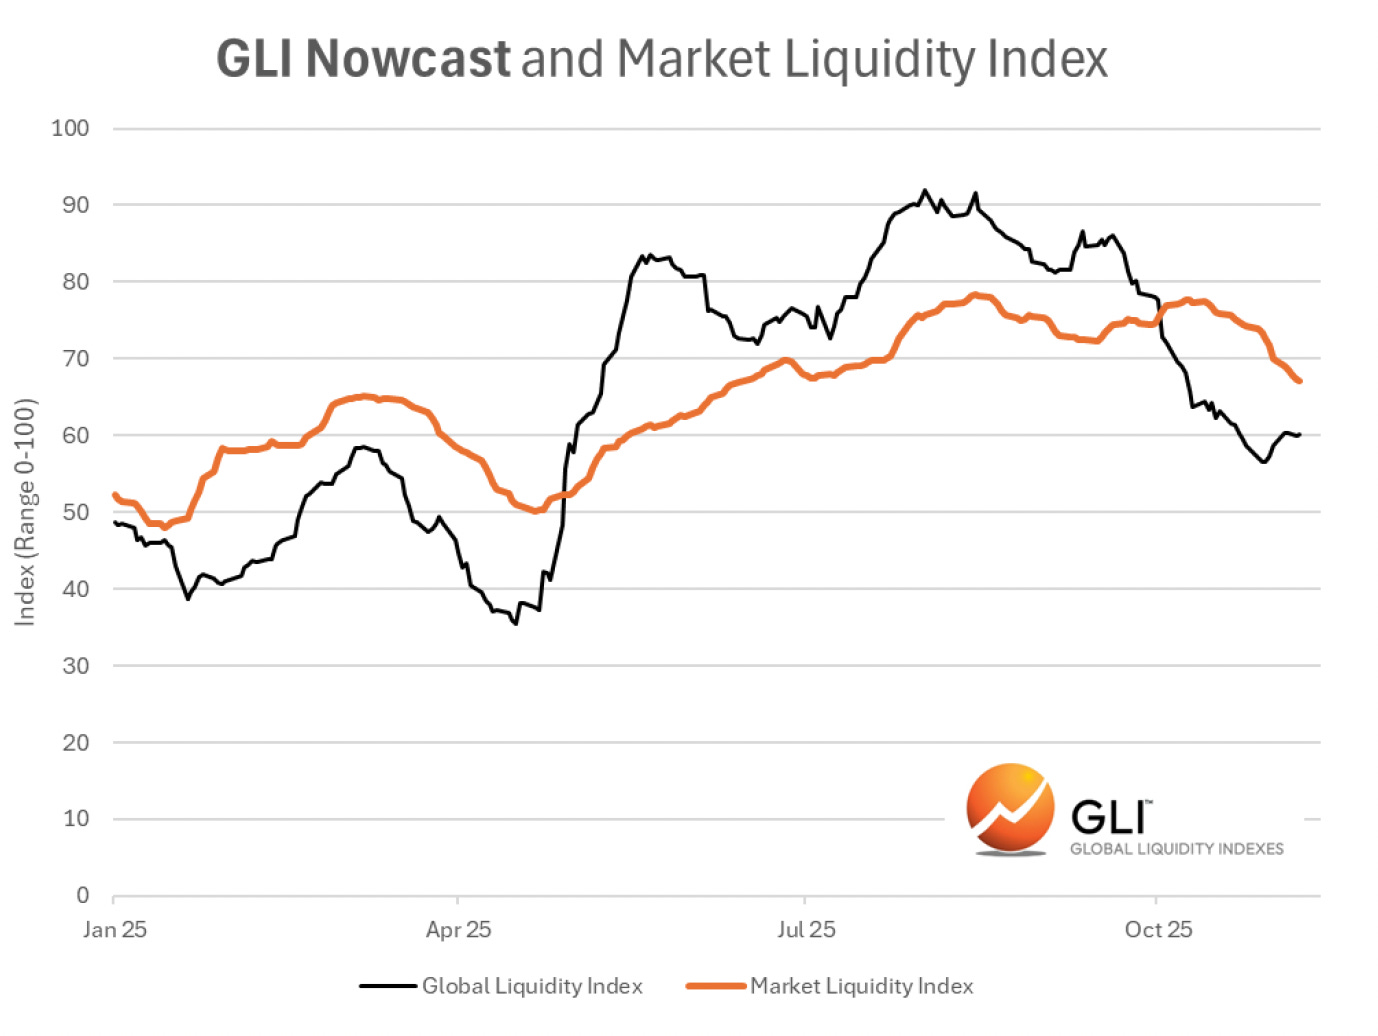
The important point:
We’re not in a full‑blown crunch yet, but the tailwind that helped almost everything go up from late‑2022 onwards is fading.
Add debt on top: why this peak is scarier than past peaks
Imagine you’ve just had a big pay rise (liquidity going up), so you take out a giant mortgage, a car loan, and a couple of cards. No problem… as long as the income keeps rising.
Now imagine the paychecks stop growing, and your fixed payments start to reset higher. Suddenly the same debt feels a lot heavier.
That’s roughly where Howell thinks the world is.
In his deck, he plots a simple ratio for rich countries:
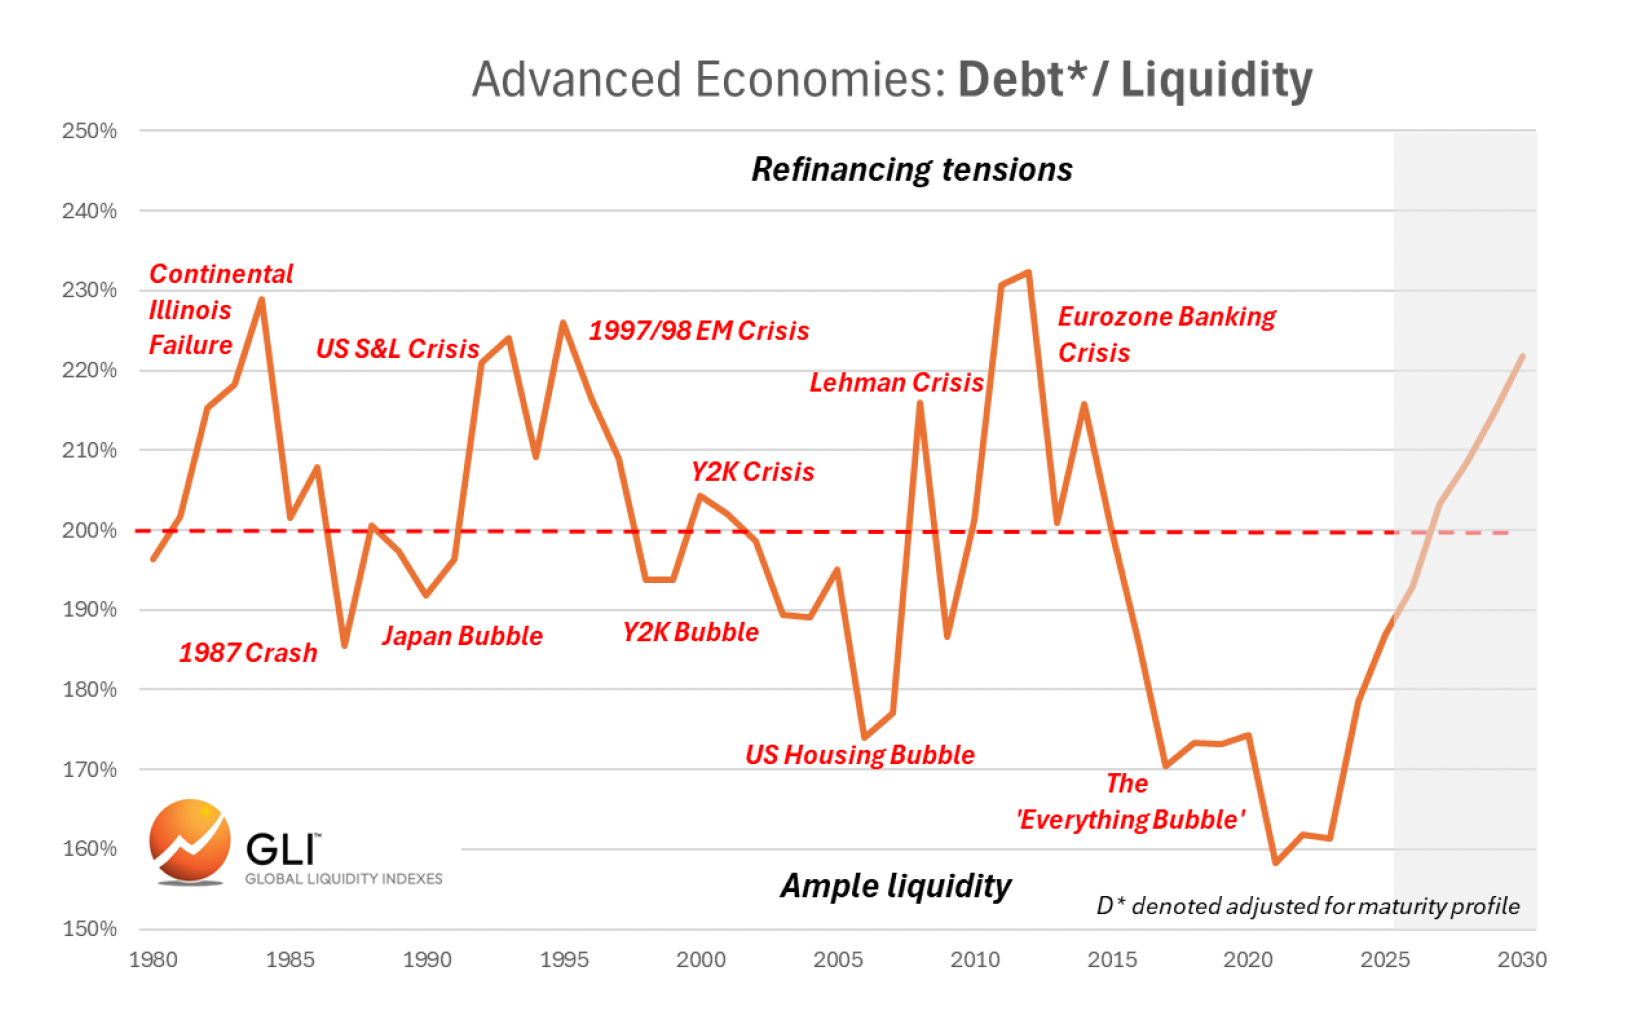
That line is now:
Higher than at previous famous stress points (’87 crash, Japan bubble, US housing bubble, Lehman, Euro crisis)
And still climbing
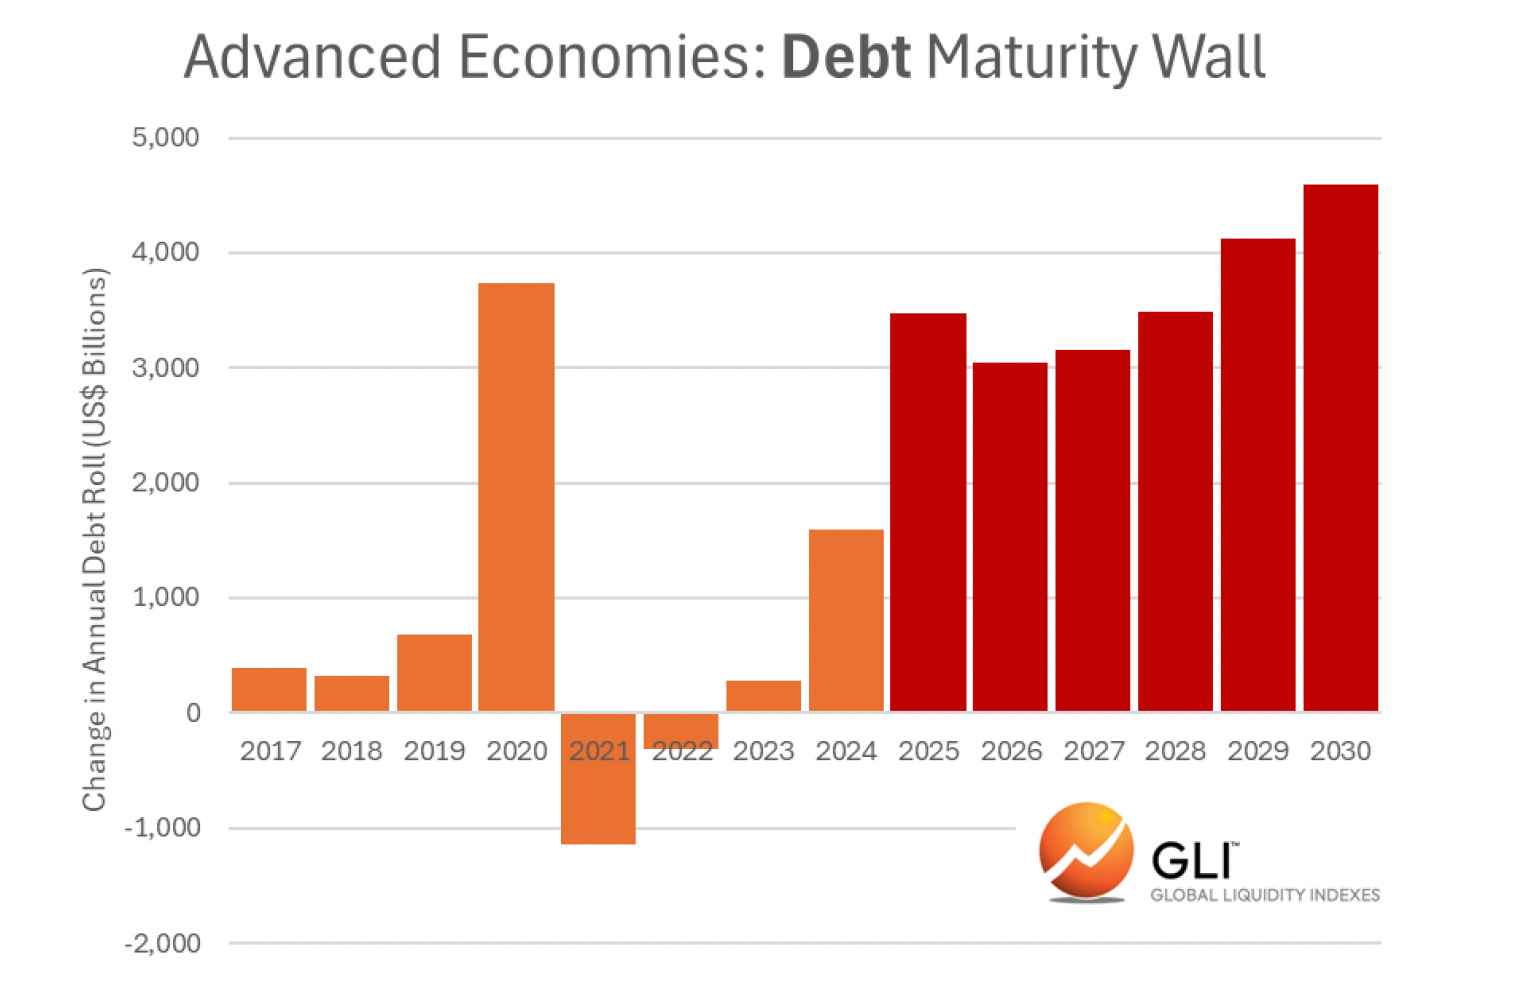
On the next slide he shows a “maturity wall”: a big block of government and corporate debt that has to be refinanced between about 2026 and 2030, after being issued in the ultra‑low‑rate COVID years.
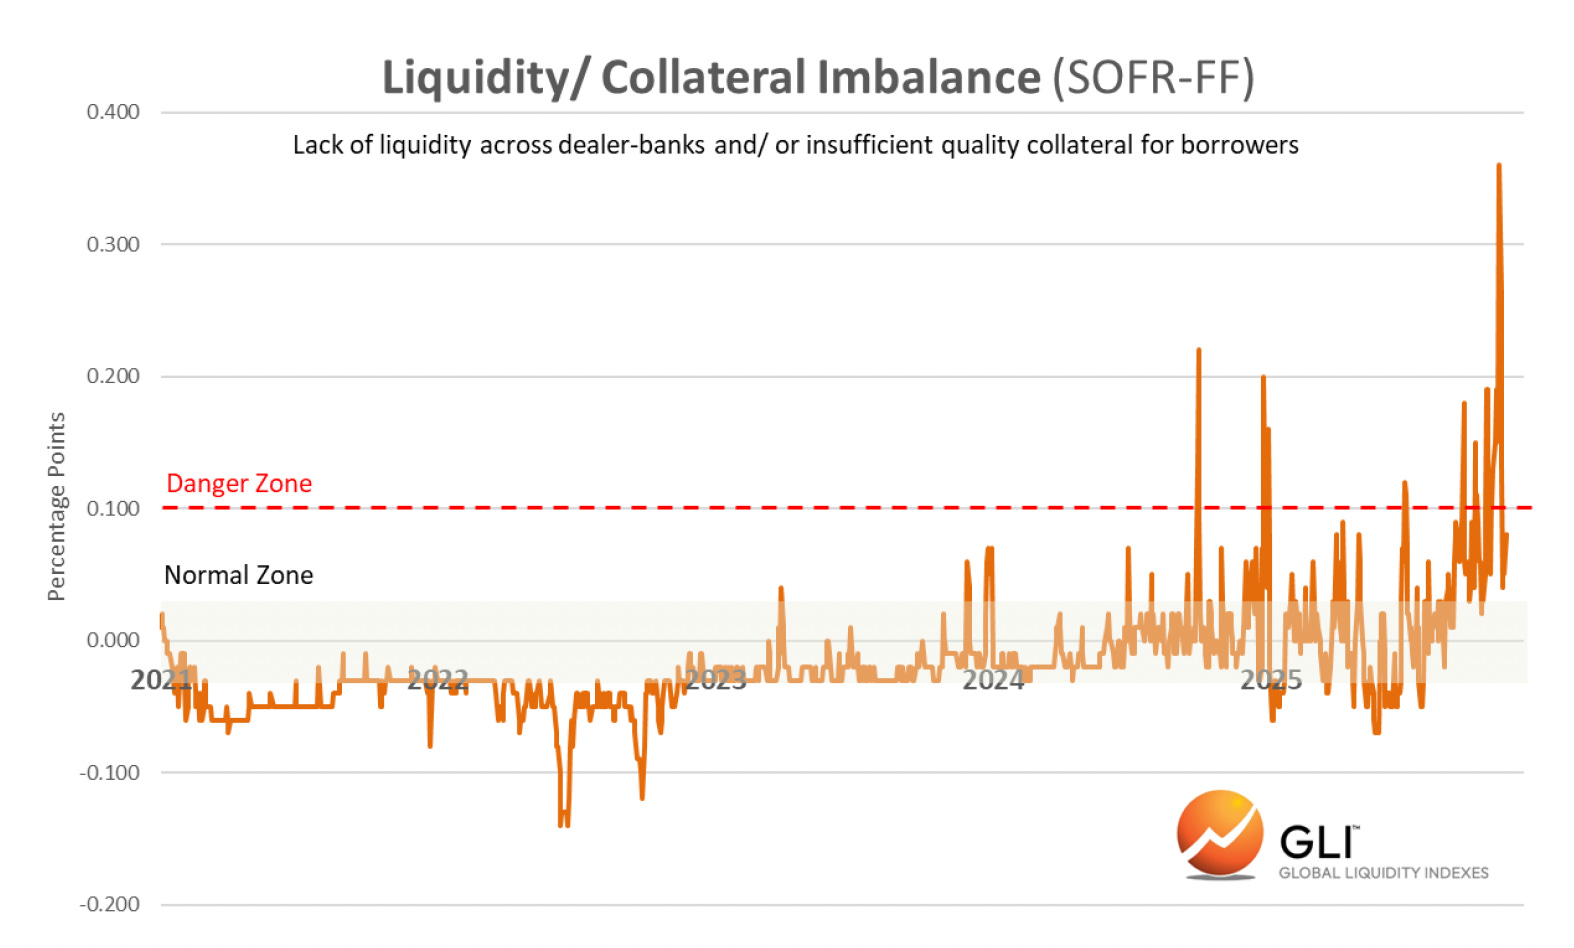
And on top of that, his measure of stress in the plumbing, a spread between two short‑term US rates (SOFR and Fed Funds), has recently spiked into a “danger zone,” which he interprets as a shortage of balance‑sheet capacity or good collateral.
There is more debt than ever resting on a “money machine” whose growth has stalled, and a lot of that debt will need to be rolled at higher interest rates in the next few years.
That’s the background against which we need to look at Japan and the yen.
The yen carry trade
The yen carry trade is one of the oldest macro trades out there. The basic idea is:
Borrow in yen, because Japanese interest rates are very low.
Convert that yen into dollars or other currencies.
Buy something that yields more: US bonds, emerging‑market debt, tech stocks, crypto, whatever.
If the world is calm…
You collect the yield difference,
The yen slowly weakens (which adds to your return),
Everyone’s happy.
If markets get rough and the yen (often a safe haven asset) suddenly strengthens, the trade goes into reverse:
Your borrowing currency gets more expensive,
The assets you bought are falling,
You get margin calls and have to sell.
That’s a carry unwind.
What happened in summer 2024 – the “dress rehearsal”
I wrote about this before, so check that out if you want, otherwise I’ll do a quick recap.
The Trades That Blew Up

If you enjoy this post, make sure to subscribe for free. Subscribers get all of my market analysis delivered directly in their inbox when it’s most relevant.
Let’s rewind to the summer of 2024, because that’s when we saw one of these carry accidents in real time.
Very quickly:
The Bank of Japan raised rates more than markets expected and hinted at buying fewer government bonds.
At the same time, some weak US economic data hit and volatility spiked.
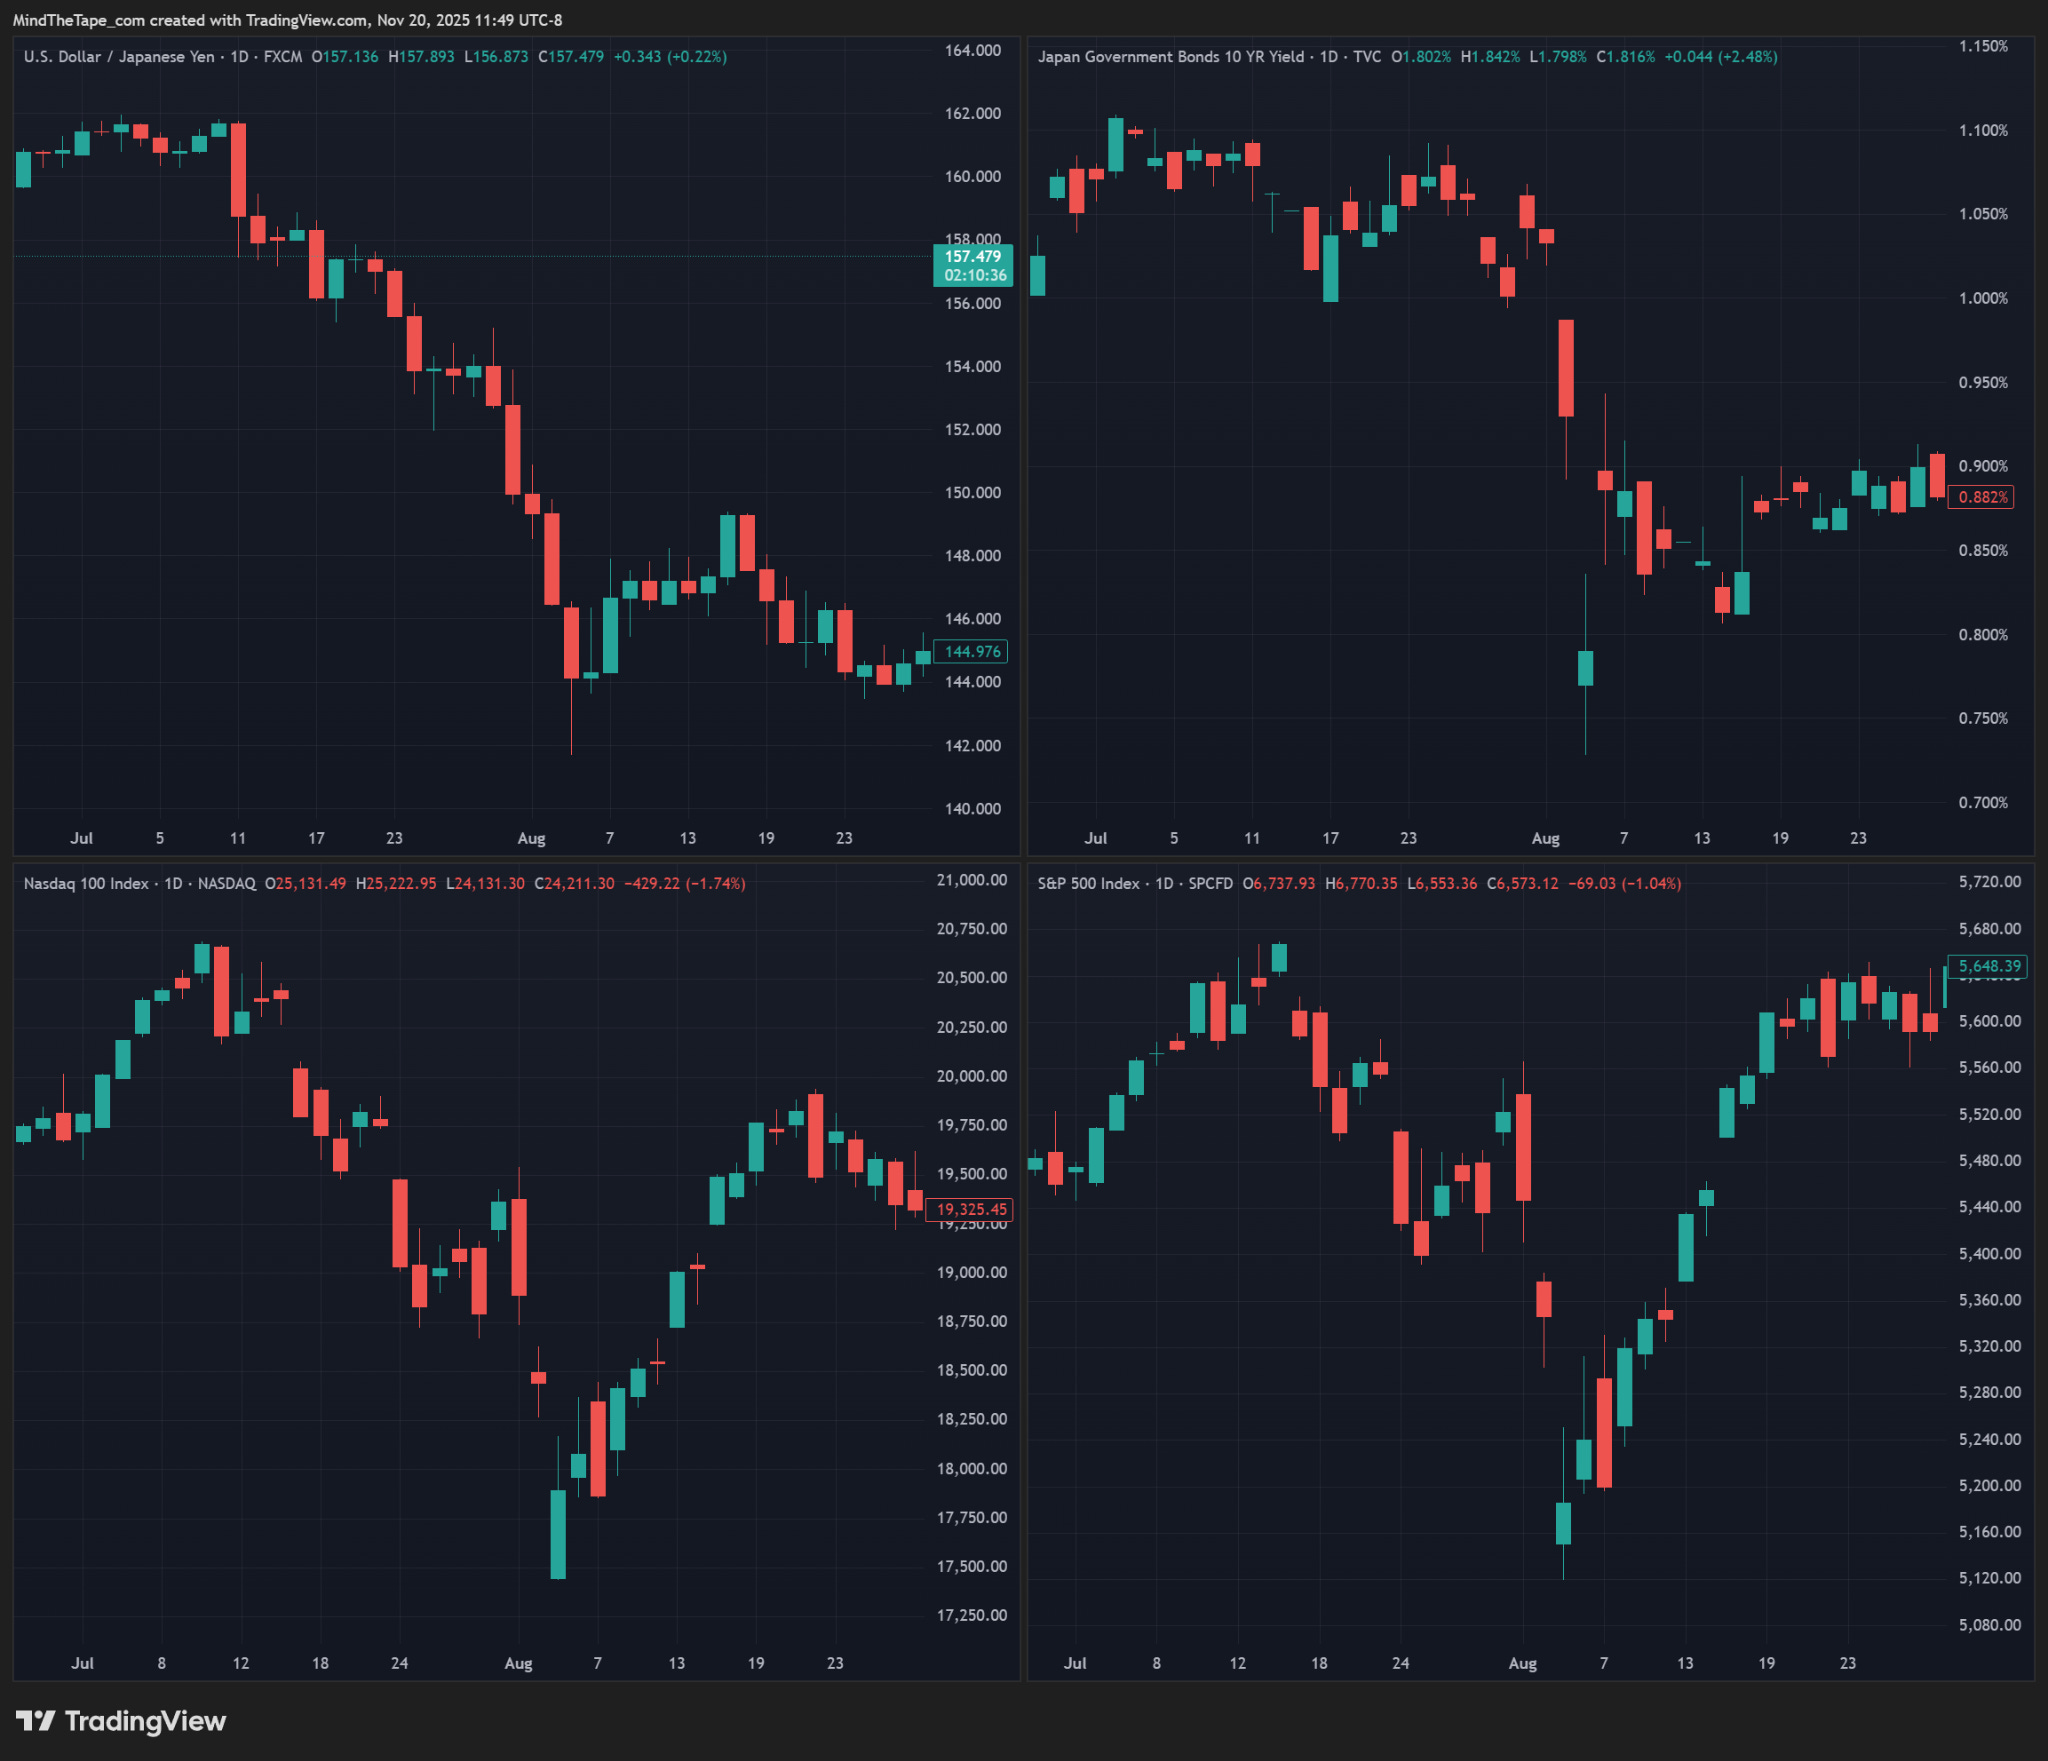
USDJPY collapsed ~20 yen in days (the yen surged).
Nasdaq and S&P futures gapped lower overnight, then bounced hard during the cash session.
Interestingly, Japanese government bond (JGB) yields fell. They acted like a safe haven.
It was nasty for anyone running “short yen, long risk” trades, but the damage was contained, and there was little lasting damage:
Global liquidity was still in the “rising” phase of Howell’s cycle.
The BoJ quickly softened its tone.
Markets re‑levered and moved on.
Think of that episode as the fire alarm going off in one room of the house, with the power grid still running at full strength.
What’s different this time in Japan
Fast‑forward to the last few months.
Now we see:
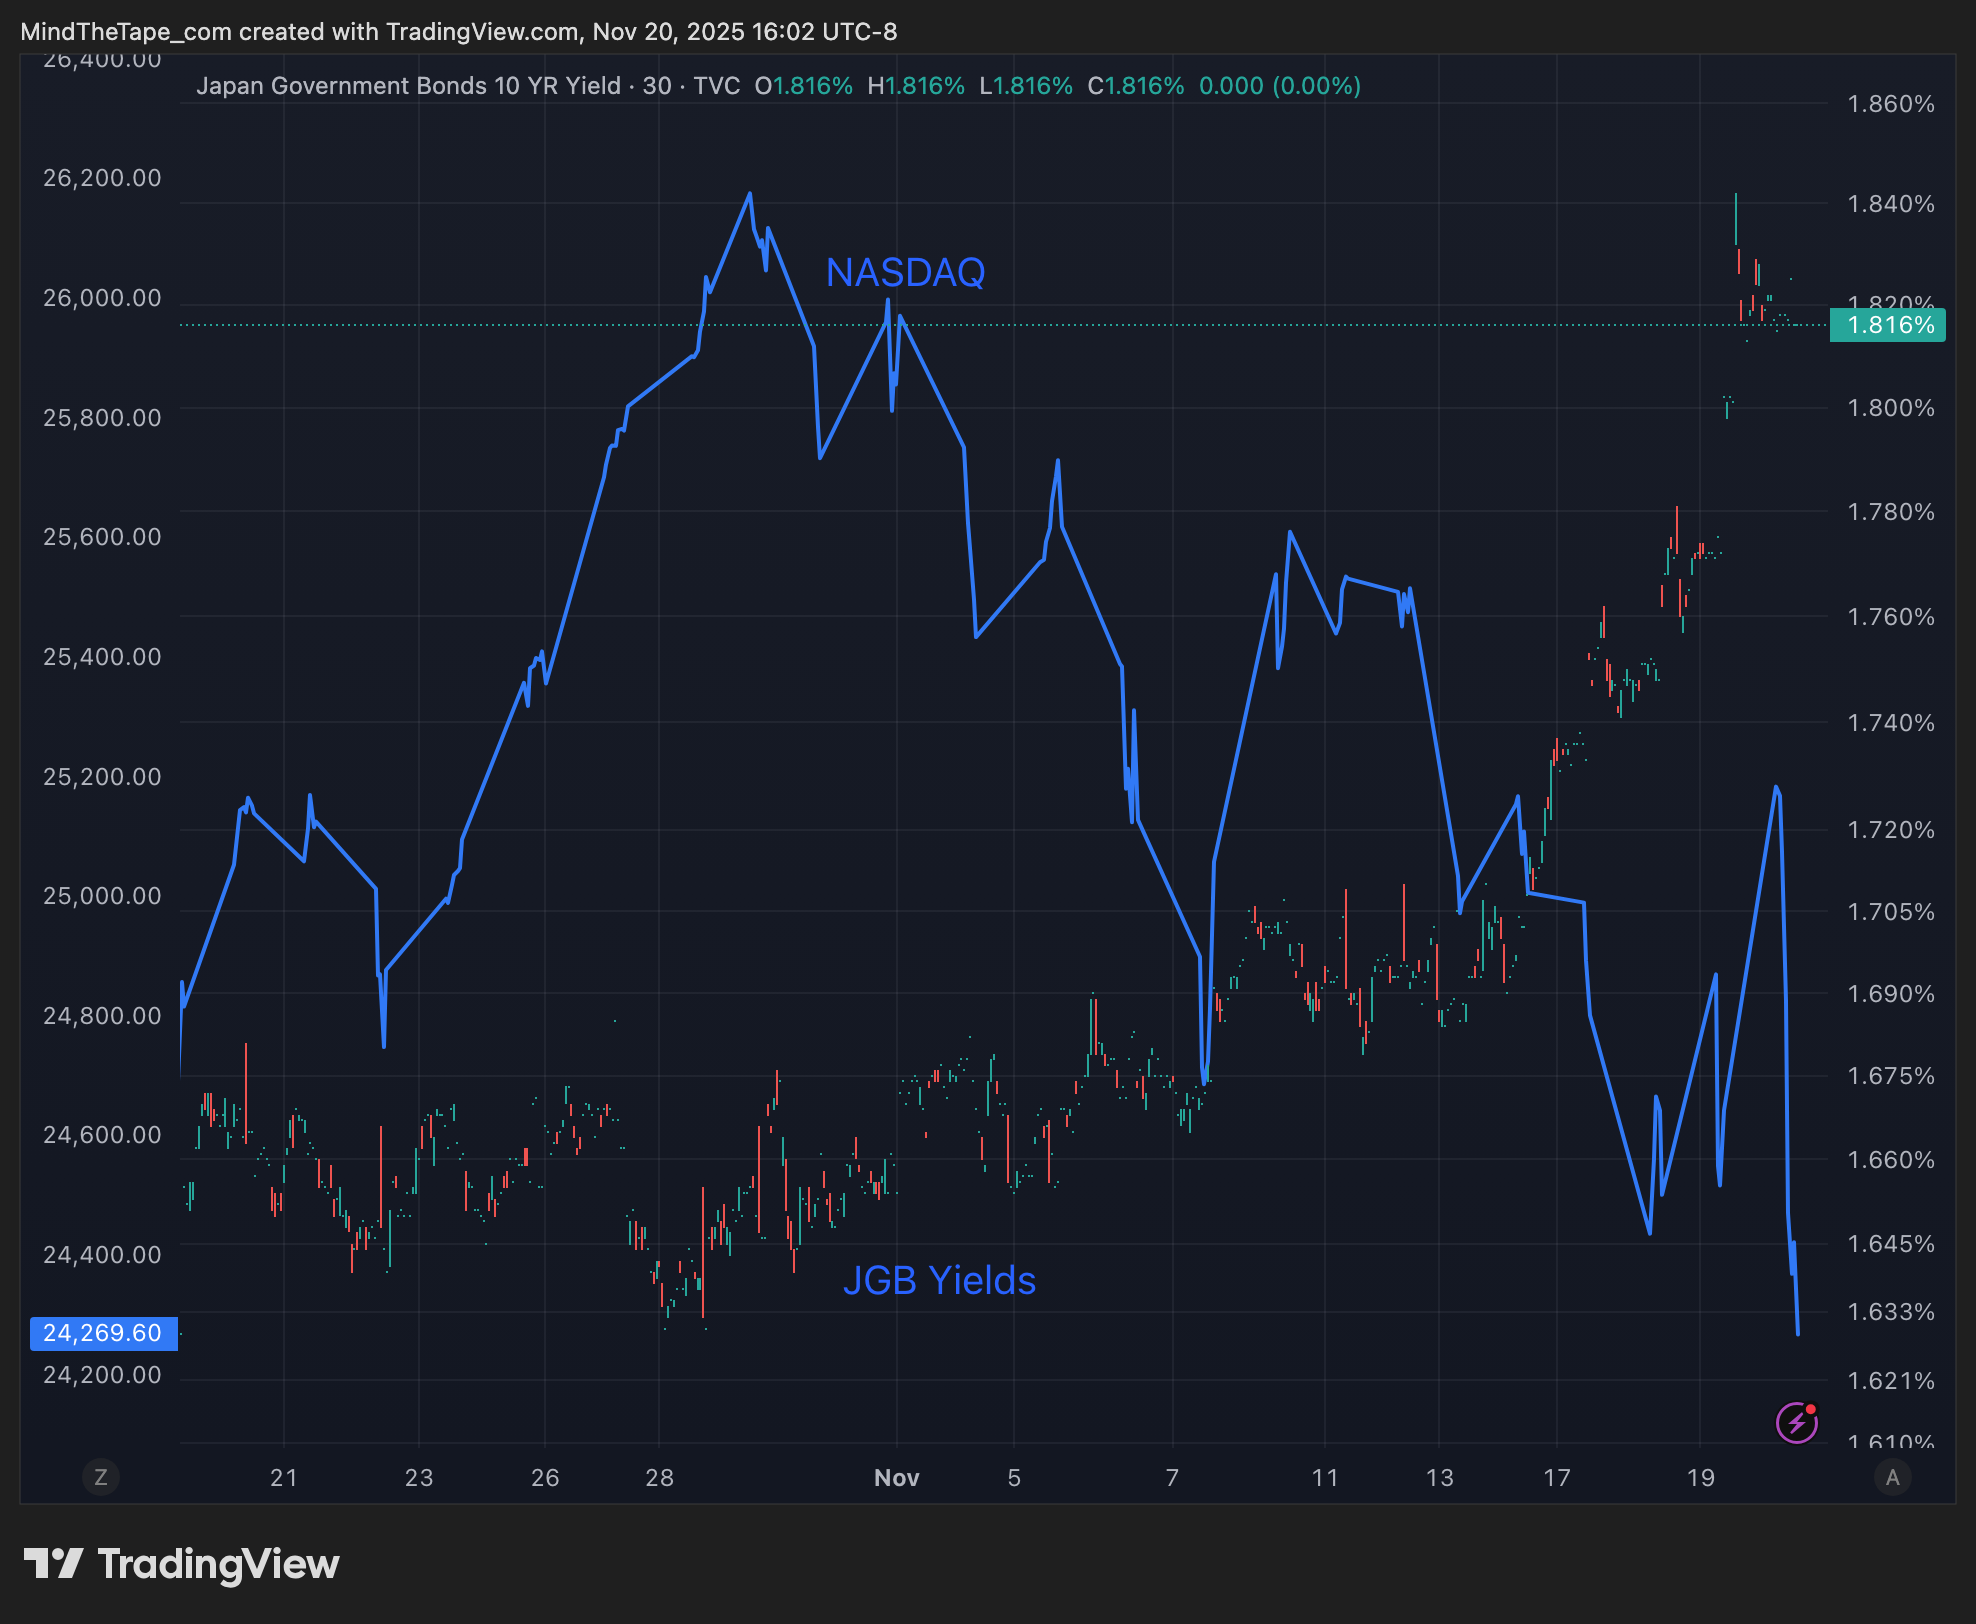
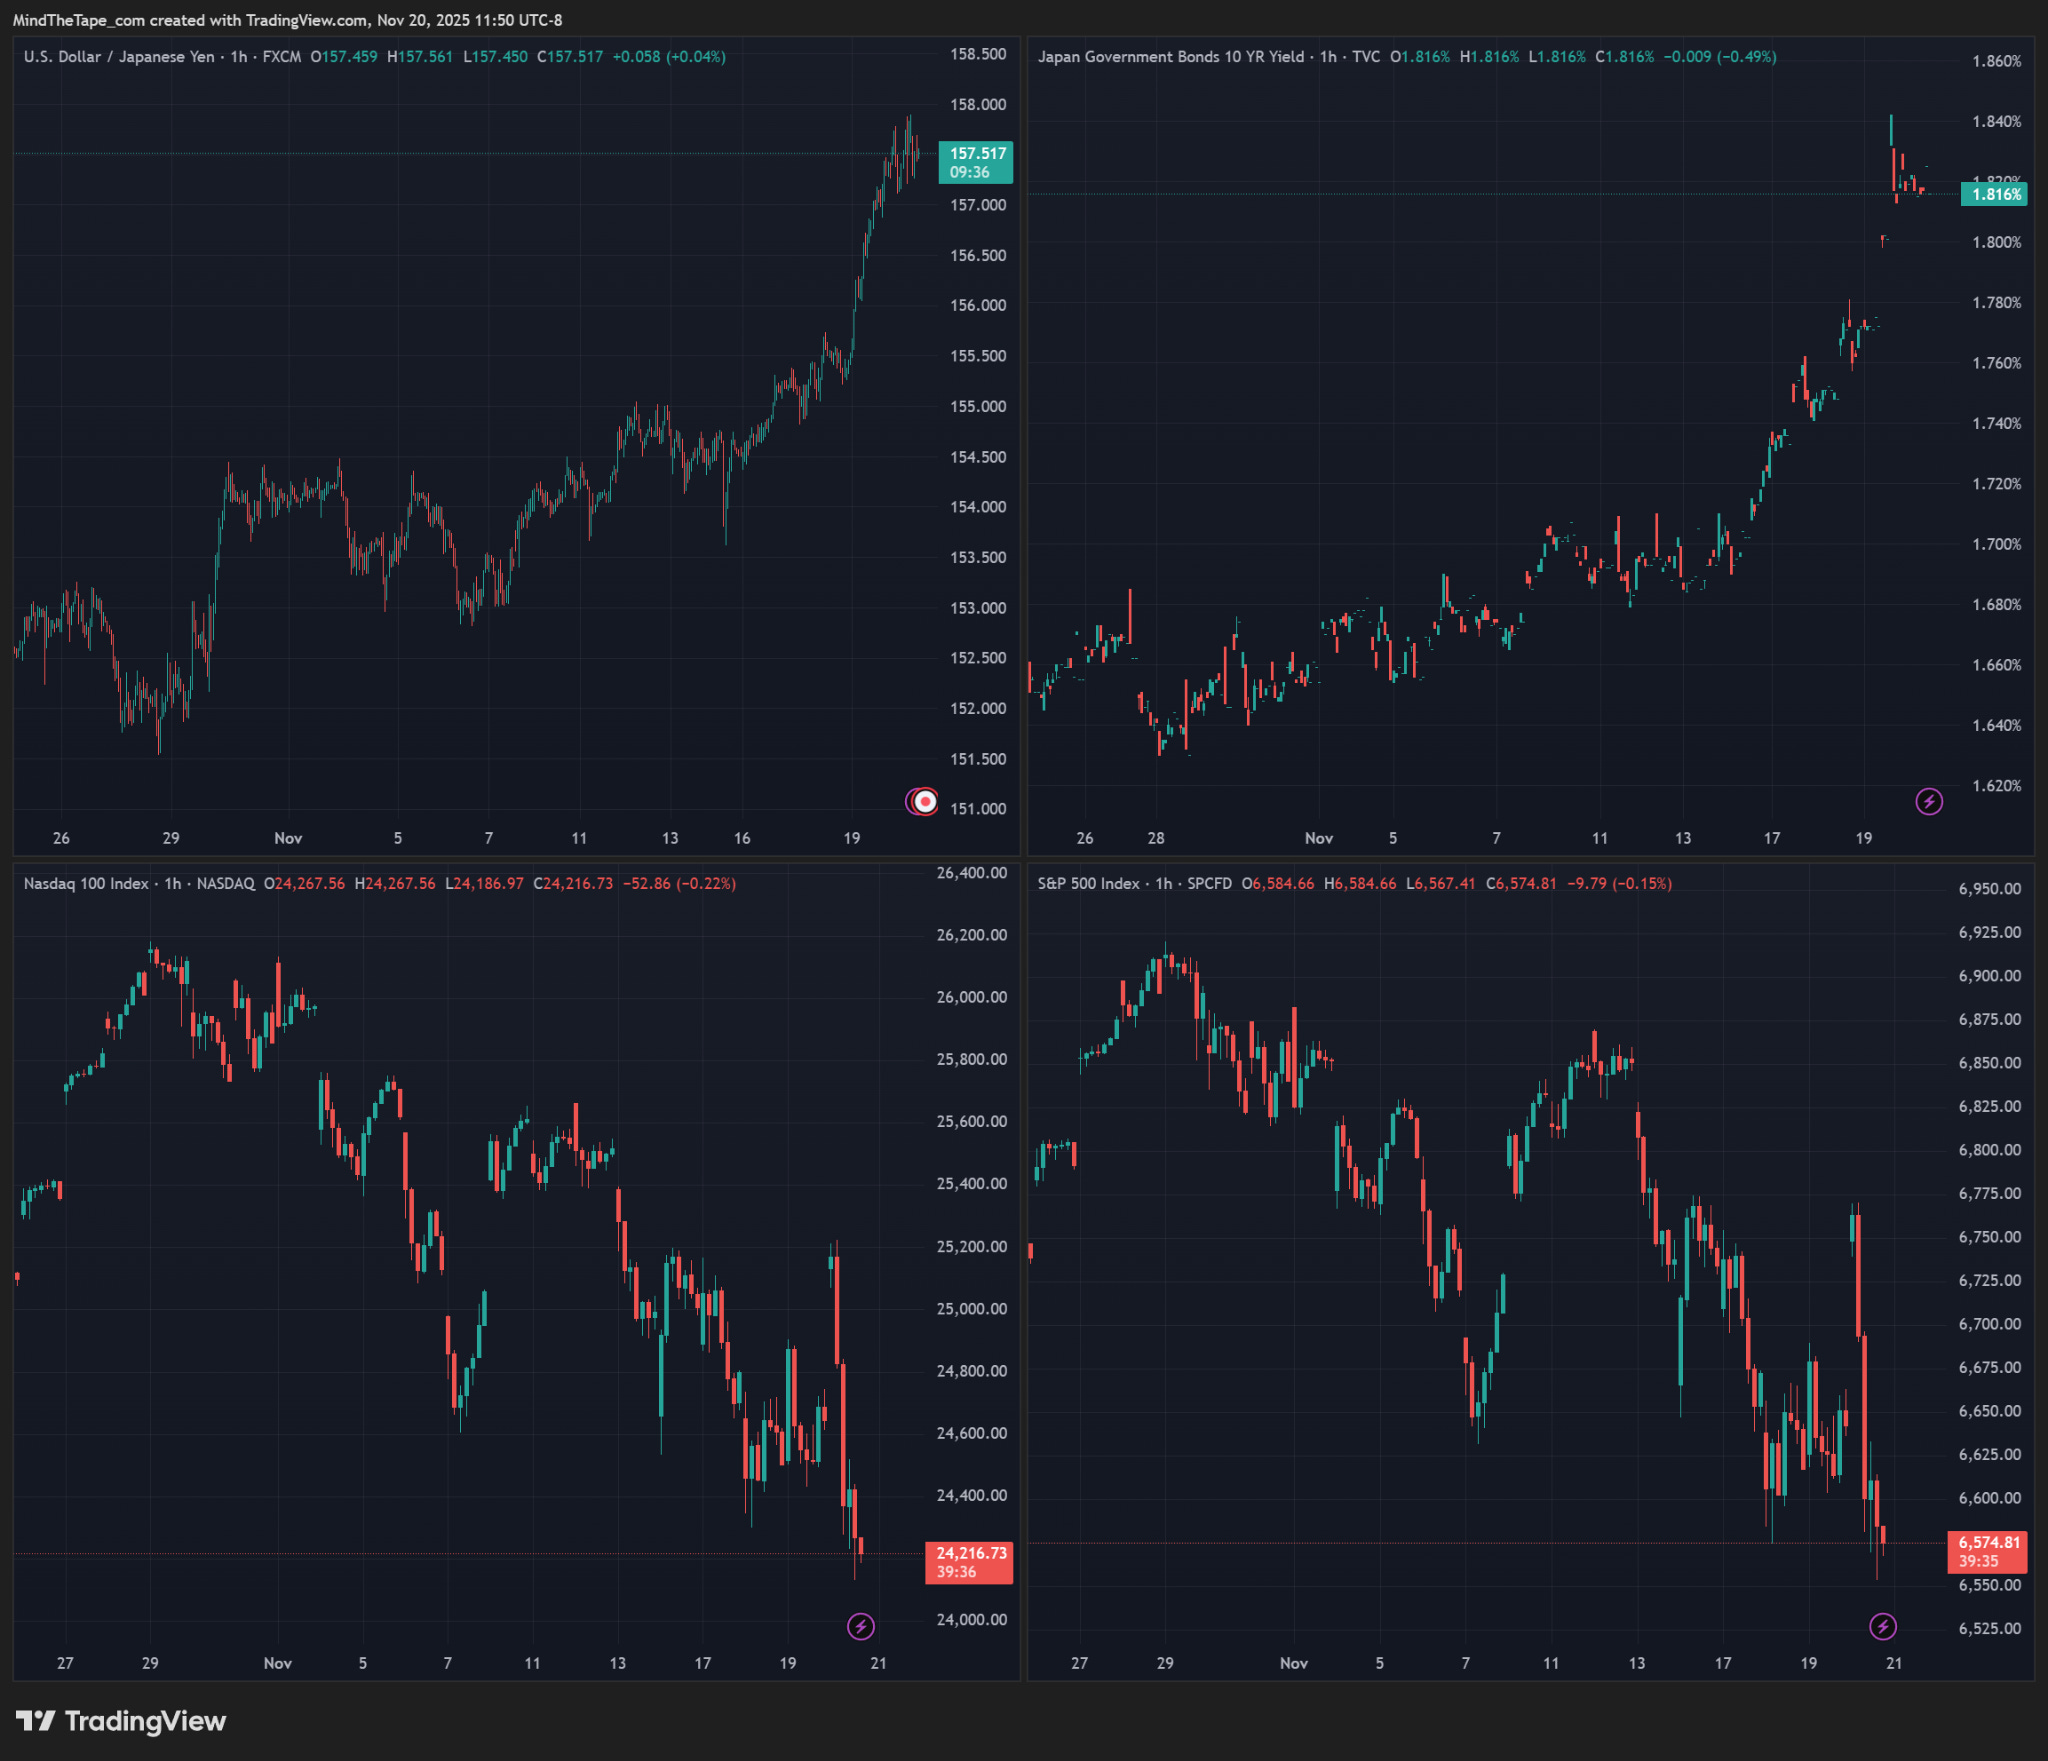
JGB yields spiking to multi‑decade highs. This is markets saying “we want more compensation to hold Japan’s long‑term debt.” You can also think of it as a supply and demand thing, IE there is more supply of JGBs than there is demand.
The yen is weak, not strong. USDJPY has been grinding higher, making the yen one of the worst‑performing major currencies. In fact, it’s getting close to levels where the BOJ has intervened in the past.
US tech and global risk assets are wobbling in a slow, grinding correction.
So unlike last summer:
This is not an “oh no, the yen just exploded higher” moment (yet).
The pressure is coming from Japan’s bond market and fiscal situation, not just from a surprise BoJ hike.
And it’s happening at the same time Howell’s charts say the global liquidity wave is topping out, not just starting to rise.
On top of that Japan is one of the most stretched balance sheets in the world: high government debt compared with the liquidity available to support it.
Why this combination is more worrying
Put all of this together and you get a different kind of risk than in 2024.
Last time: “local accident, global tailwind”
In 2024:
Global liquidity was accelerating out of the post‑COVID slump.
The yen surge was mostly an FX and volatility shock.
JGBs rallied; BoJ could calm things just by taking a softer stance on hikes
The rest of the world still had spare balance‑sheet capacity to absorb losses and rebuild positions.
Now: “late‑cycle stress at a weak point”
Today, according to Howell’s framework:
The global liquidity tailwind has stopped getting stronger and is starting to fade.
Debt levels vs liquidity are worse than at previous famous crises, and a big chunk of that debt will be rolled over in the next five years.
Japan is a heavily indebted country trying to normalise monetary policy, with its bond market already under pressure and its currency still used for funding.
That mix means:
If something goes wrong in Japan now, it doesn’t hit a world with plenty of unused balance sheet.
It hits a world where everyone is already pretty full on debt.
That’s why people are suddenly talking about Japan and the yen carry trade again in the context of “global liquidity peaking.”
What a really bad version would look like
To be clear: none of this guarantees a crisis. I simply wanted to write this to make you aware of a growing risk. But if you wanted to sketch how a truly nasty episode might unfold, it would probably look something like this:
Bond stress intensifies
JGB yields push higher in a disorderly way; investors start questioning Japan’s general sustainability.Policy makers panic about the currency or the bond market (or both)
Perhaps the Ministry of Finance intervenes aggressively to support the yen.
Or the BoJ changes course again,, either hiking more than expected to defend the currency, or buying huge amounts of bonds to cap yields.
The yen suddenly spikes higher
That’s the moment the carry trade breaks climactically: funding costs jump and anyone who was short yen and long risky assets gets hit on both sides.Global risk assets sell off as positions are unwound
Tech, EM, credit, crypto, anything funded in cheap yen, could see forced selling.This happens with global liquidity already rolling over
So instead of markets easily digesting the shock (like 2024), it collides with the refinancing wall and tight collateral conditions.
Again, this is a scenario, not a prediction. But it’s the reason people suddenly care a lot about what used to be a very boring government bond market.
If you want one simple takeaway
Here’s the punchline I’d give:
For the last couple of years, the world has been surfing a big wave of “easy money” in a very broad sense, with lots of balance‑sheet capacity, strong cross‑border flows, everyone happy to take risk.
That wave looks like it’s cresting. The growth in that “money machine” has slowed.
At the same time, we’re carrying more debt than ever on top of it and heading into a period where a lot of that debt needs to be refinanced.
Japan, huge debt, changing central bank policy, stressed bond market, weak funding currency, is one of the places where a late‑cycle accident is most likely to show up.
The yen carry trade, which worked beautifully on the way up, is now a potential transmission channel for stress on the way down.
So when you see headlines about Japanese yields spiking, or the yen suddenly surging, it’s not just a local story about Tokyo. It’s one of the key pressure points in the global financial system, right at the moment when the tide that’s been lifting all boats may be starting to turn.
Zooming out
I don’t want this post to come off as alarmist. In general, I hate people who start macro doom posting at the lows. We are down 550bps in SPX, and that’s hardly cause for elaborate doom posting…
But I wanted to write this post because I think the fading liquidity, the Fed’s current desire to be overly careful with cutting (December cut is down to ~32%), and the carry trade stuff leads to a window of concern here, and might explain the otherwise very strange price action this week.
Good luck out there.
Disclaimer: The information provided here is for general informational purposes only. It is not intended as financial advice. I am not a financial advisor, nor am I qualified to provide financial guidance. Please consult with a professional financial advisor before making any investment decisions. This content is shared from my personal perspective and experience only, and should not be considered professional financial investment advice. Make your own informed decisions and do not rely solely on the information presented here. The information is presented for educational reasons only. Investment positions listed in the newsletter may be exited or adjusted without notice.