

Author’s Note: I will continue releasing free content where I can provide value to everyone. Posts will include premium content for paid subscribers at the end of emails or as separate write-ups. Free content will focus on macro views, whereas the paid content will focus more on the tactical trades I’m making.
Serious traders or investors should join Premium to get the best, most timely information.
I’m writing this late at night, so I will keep it short and sweet.
Yesterday, we saw the worst day in US markets since the 2020 COVID crash.
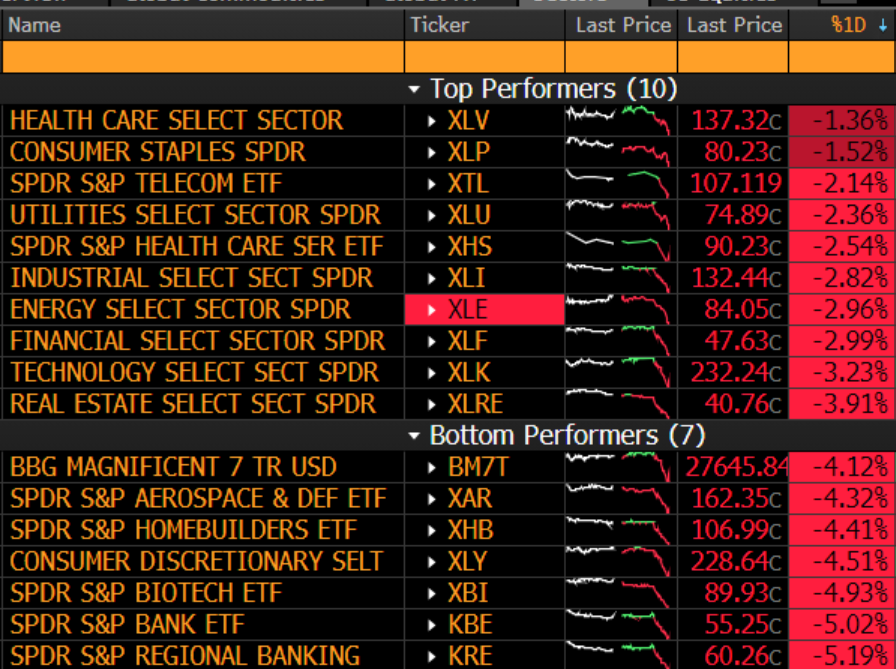
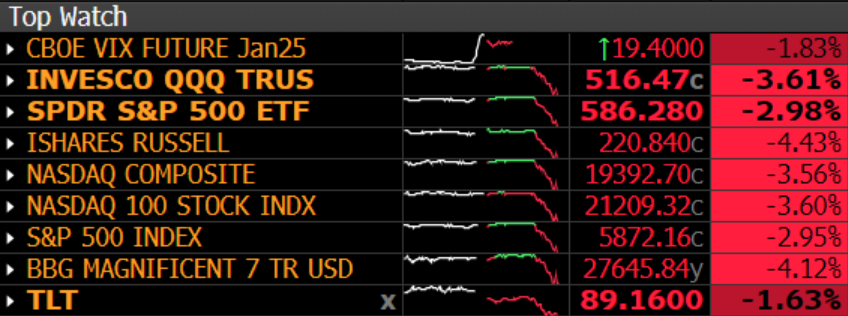
Every sector was red. It was a massive sell-off across the board.
We know the catalyst was the “hawkish cut” I made fun of the other day. I’ve said, “There’s no such thing as a hawkish cut,” and I stand by that sentiment. A cut is inherently dovish.
So then, why did the market sell-off so violently? What happened?
Rate Expectations
On Fed days, three things happen.
The Fed announces its rate decision. In this case, it was an utterly unsurprising 25 bps cut.
The Fed releases its SEP, or summary of economic projections.
The Fed Chairman gives a press conference where he takes journalist’s questions.
Based on all this data, the market adjusts its rate cut expectations accordingly. So, let’s take a look at that first.
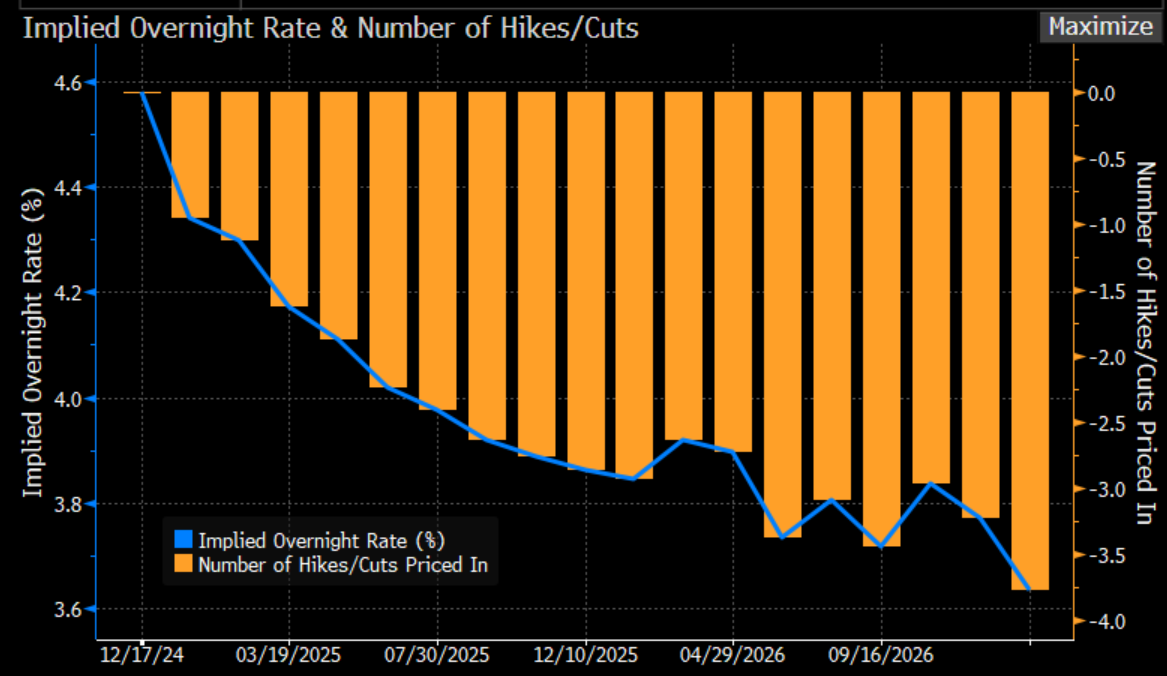
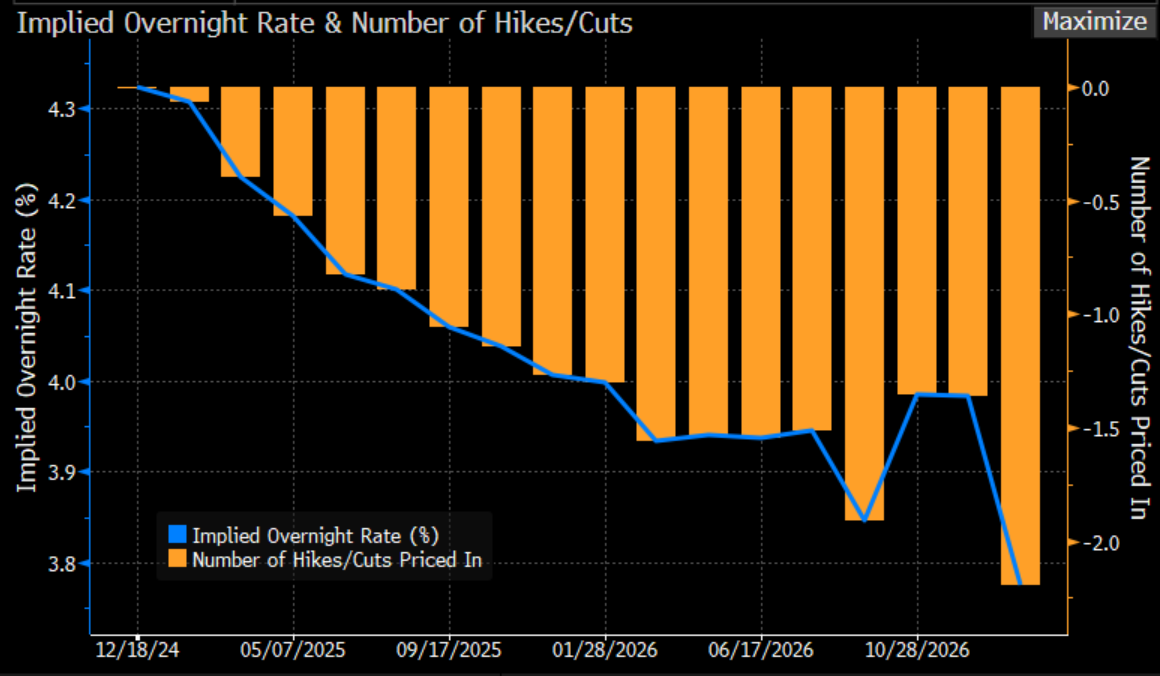
It’s a little hard to read these charts, but the market went from expecting around 1.9 cuts in 2025 to only 1.26. Obviously, there’s no such thing as a fractional cut, but the fractions are the market’s way of saying, “We are expecting 1 cut with a 90% chance of a second,” more or less.
Could pricing out 65% of a 25bps cut really have taken the market down?
No.
The catalyst for the sell-off was an easily overlooked piece of data in the SEP, which, combined with excessively stretched market positioning, created a liquidity vacuum.
Let’s look at the market positioning first.
Market Positioning and Dealer Gamma
This Friday is a “triple witching” option expiration, which means a considerable number of options expire this week. This sets up unusual moves, like the one we got this week.
There’s also an exceptionally large set of ES 6055 call options expiring at the end of the month.
These two events combine to create some unusual market dynamics.
Triple Witching Volatility
The upcoming triple witching event, when stock index futures, stock index options, and individual stock options simultaneously expire, creates heightened market activity. Traders often unwind or adjust positions ahead of this date, which can trigger increased volatility and directional market moves. This pre-triple witching repositioning is likely contributing to the sell-off.Options Pinning and Gamma Exposure at ES 6055
The large expiring call position at ES 6055 has been "pinning" the market around that level due to market makers' hedging activity. As the underlying price moves, market makers adjust their hedges, often amplifying price moves around key strike levels. We moved so far away from this strike today that dealers no longer had to hedge the position, and when that happened, a huge amount of liquidity left the market.
On top of that, we’ve seen a surprising rally of momentum stocks this month while value has been historically beaten down. This is partly due to the pinning effects of that 6055 position—when a stock like Tesla is on its’ epic rally, other stocks in the S&P500 have to sell off to pin the price.
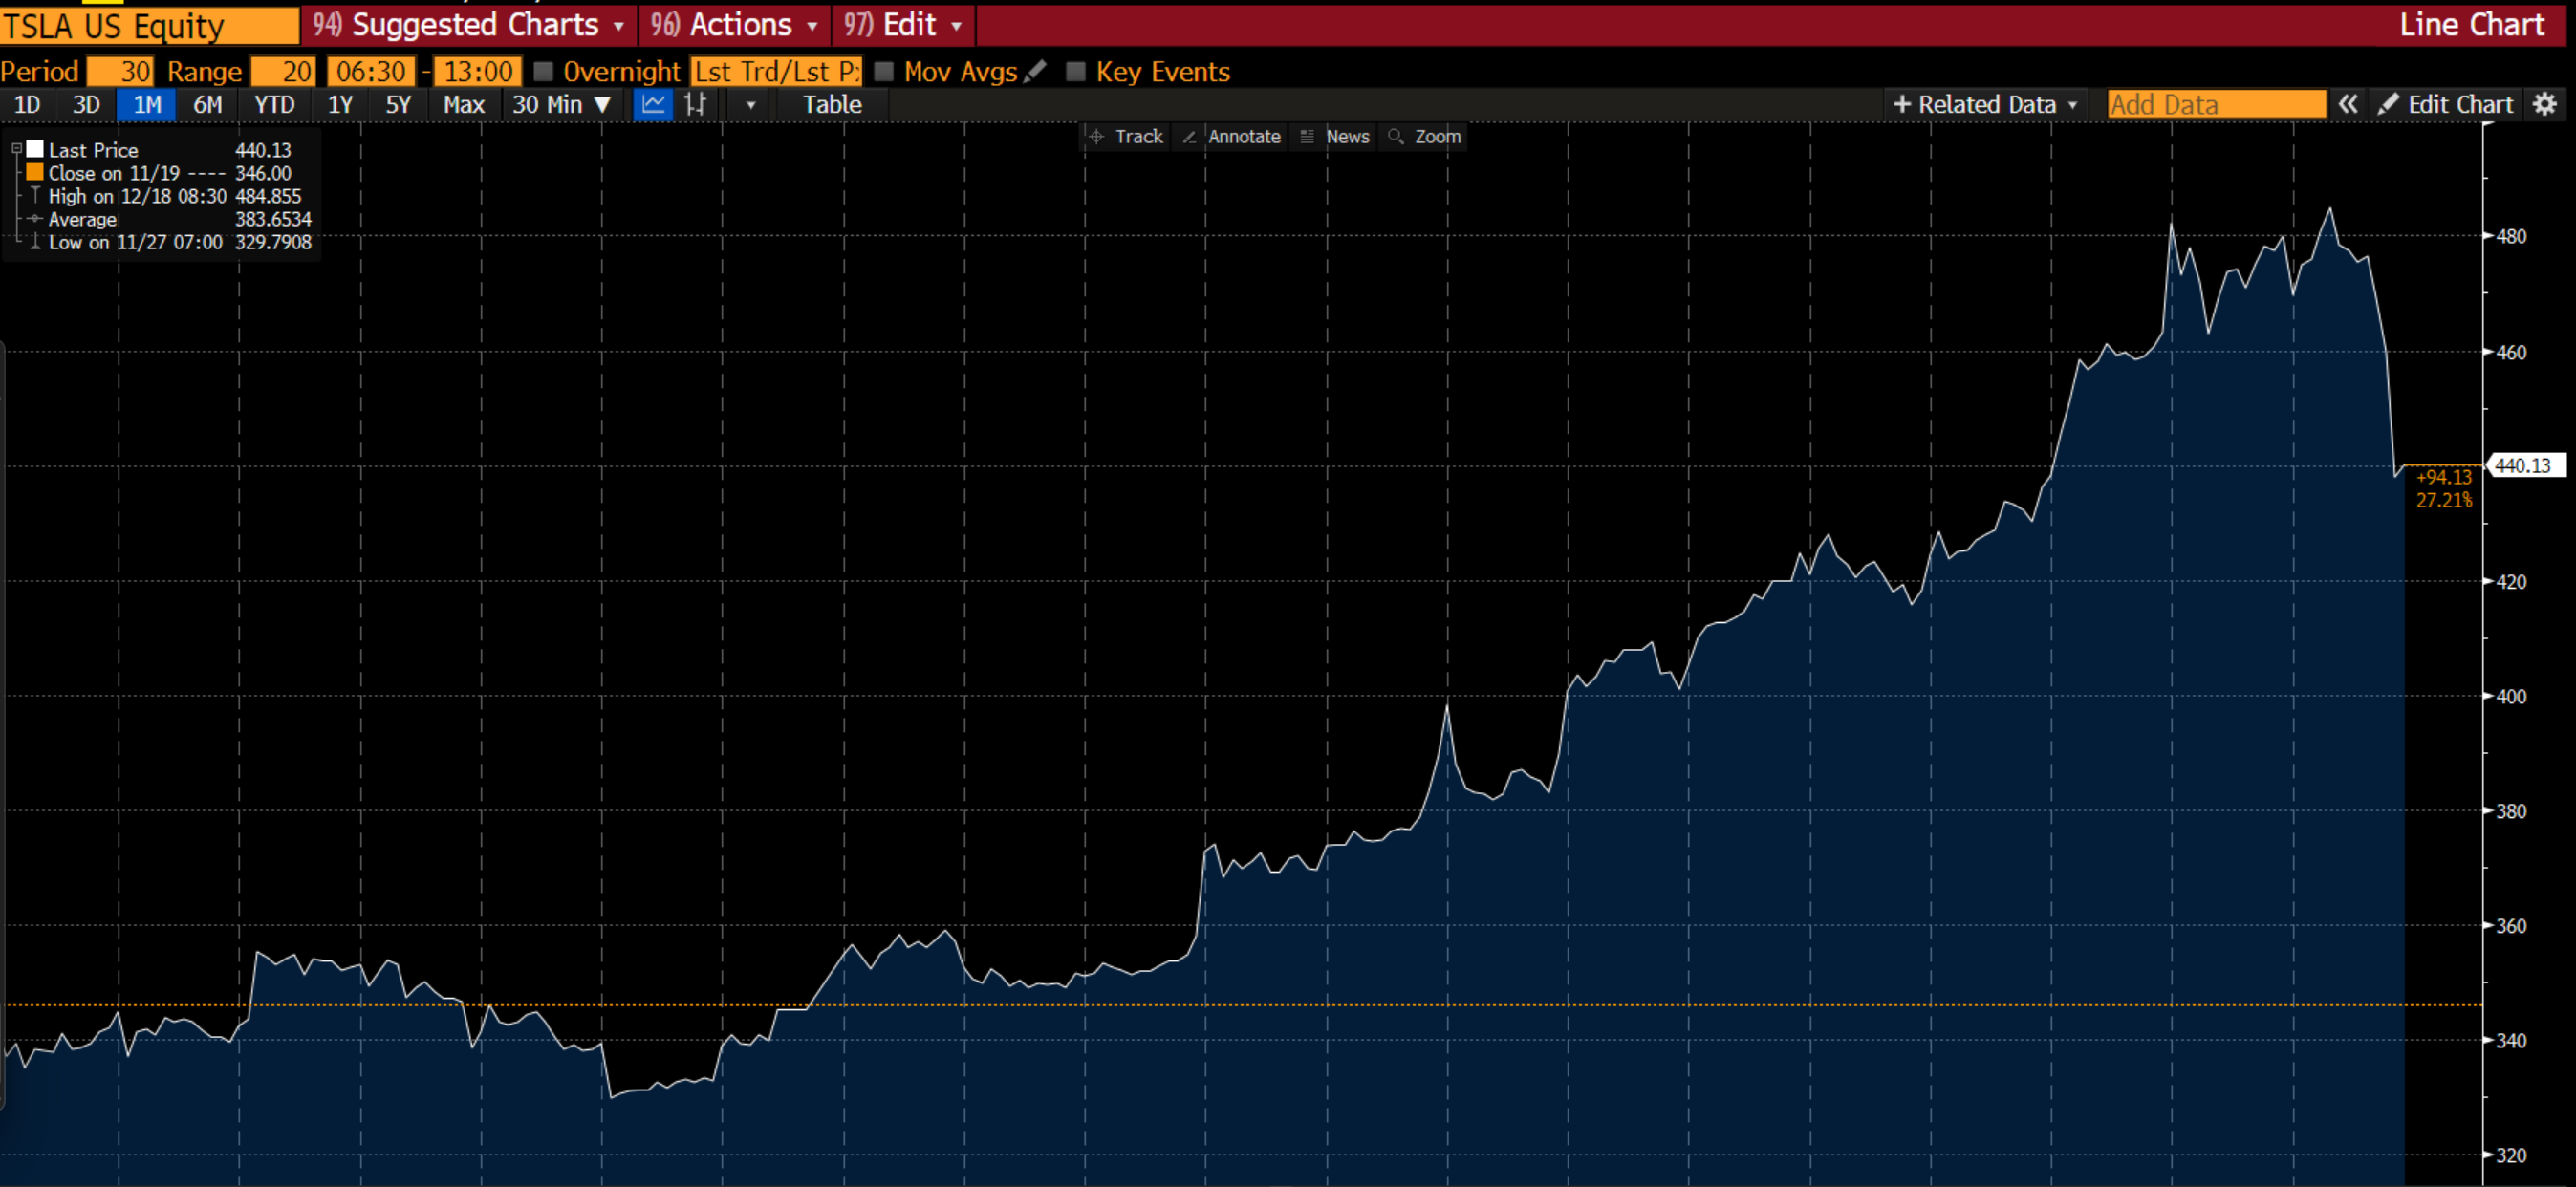
I mean, just look at that TSLA chart. It had to be causing some dislocations.
At the same time, as we rush into the year-end, portfolio managers caught in value stocks are forced to sell to chase the momentum of stocks like TSLA or risk giving up the ghost on the year’s performance.
Combining this with an exogenous shock gives an absolute vortex of market forces.
So, what was the exogenous shock?
Inflation Expectations
One extremely notable piece of data in the SEP: The Fed’s inflation expectations have changed dramatically.
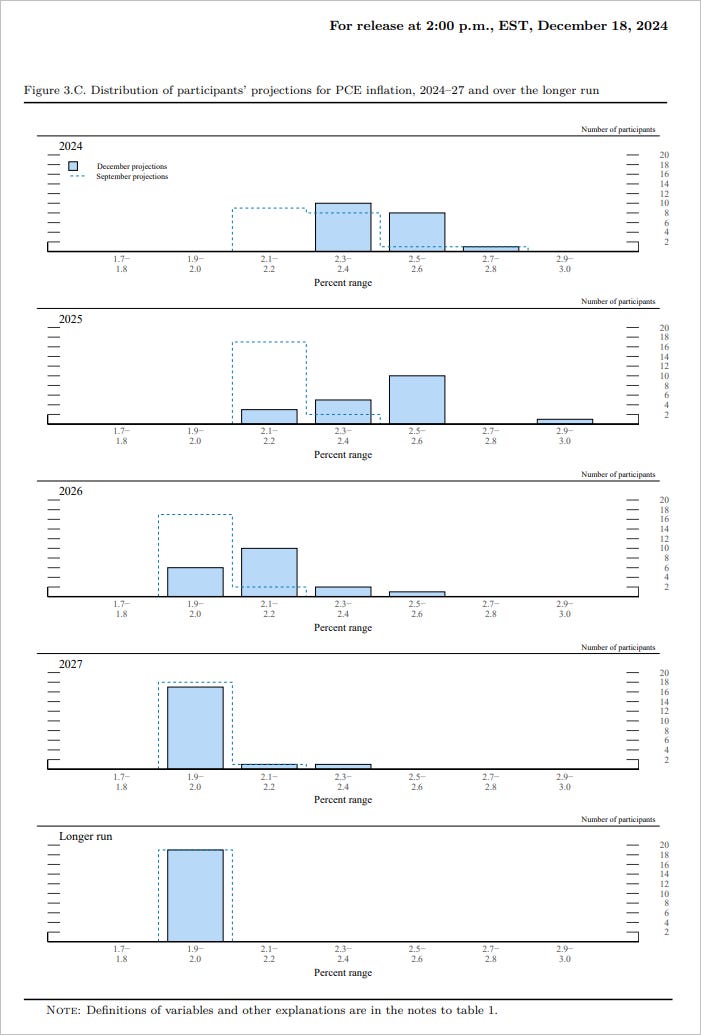
Because that chart is challenging to read, I’m going to steal an excellent chart from Kevin Muir at themacrotourist.com
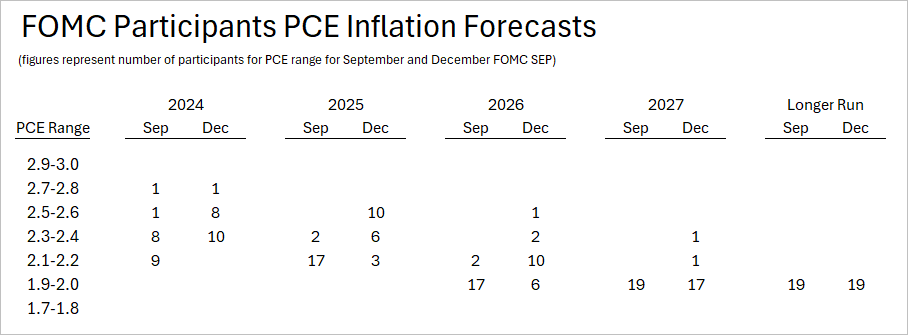
Look at how inflation expectations changed from the September meeting. Whereas previously, nearly all members expected inflation to return to near-target (2%) next year, now only 3 (!!!) do. Now, the vast majority don’t expect us to return to target or near-target until 2026, and even then, a handful think it won’t happen until 2027 or later!
This is actually an explosive revelation for markets because it deeply affects both how the Fed can be expected to act and, if the projections are true, how the market should value risk assets today.
Hence the most volatile day since 2020.
Looking Ahead
The real question is: Is the volatility behind us, or are we in for more? Unfortunately, I can’t answer that directly, but I can give you my best thoughts.
Let’s look at the Factors concept I introduced yesterday (it feels like a lifetime ago).
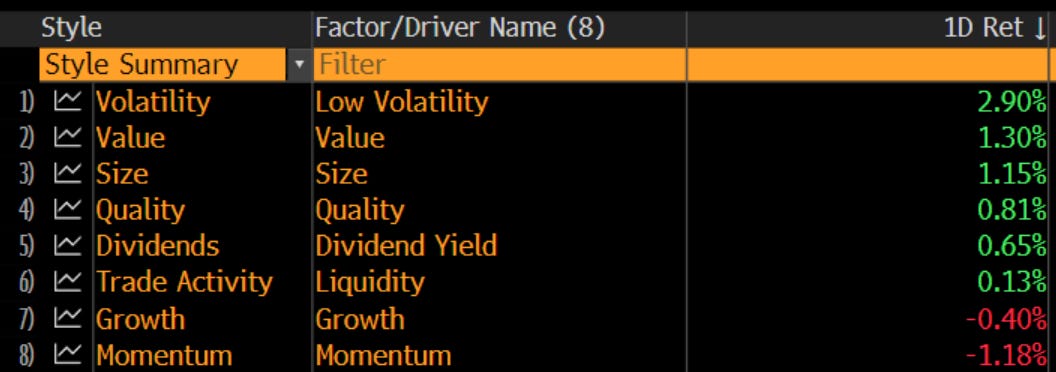
You can see a departure from what’s been working most of this year. Longing a basket of Low Volatility, Value, and Quality companies shorted against their counterparts would have been a big winner.
The reverse is true of things like Growth and Momentum.
This is a clue that we might be starting the value rotation in earnest today, which fits 100% with the idea that this market dislocation was caused by the Fed’s inflation expectations.
In a more highly inflationary world, it pays to own value.
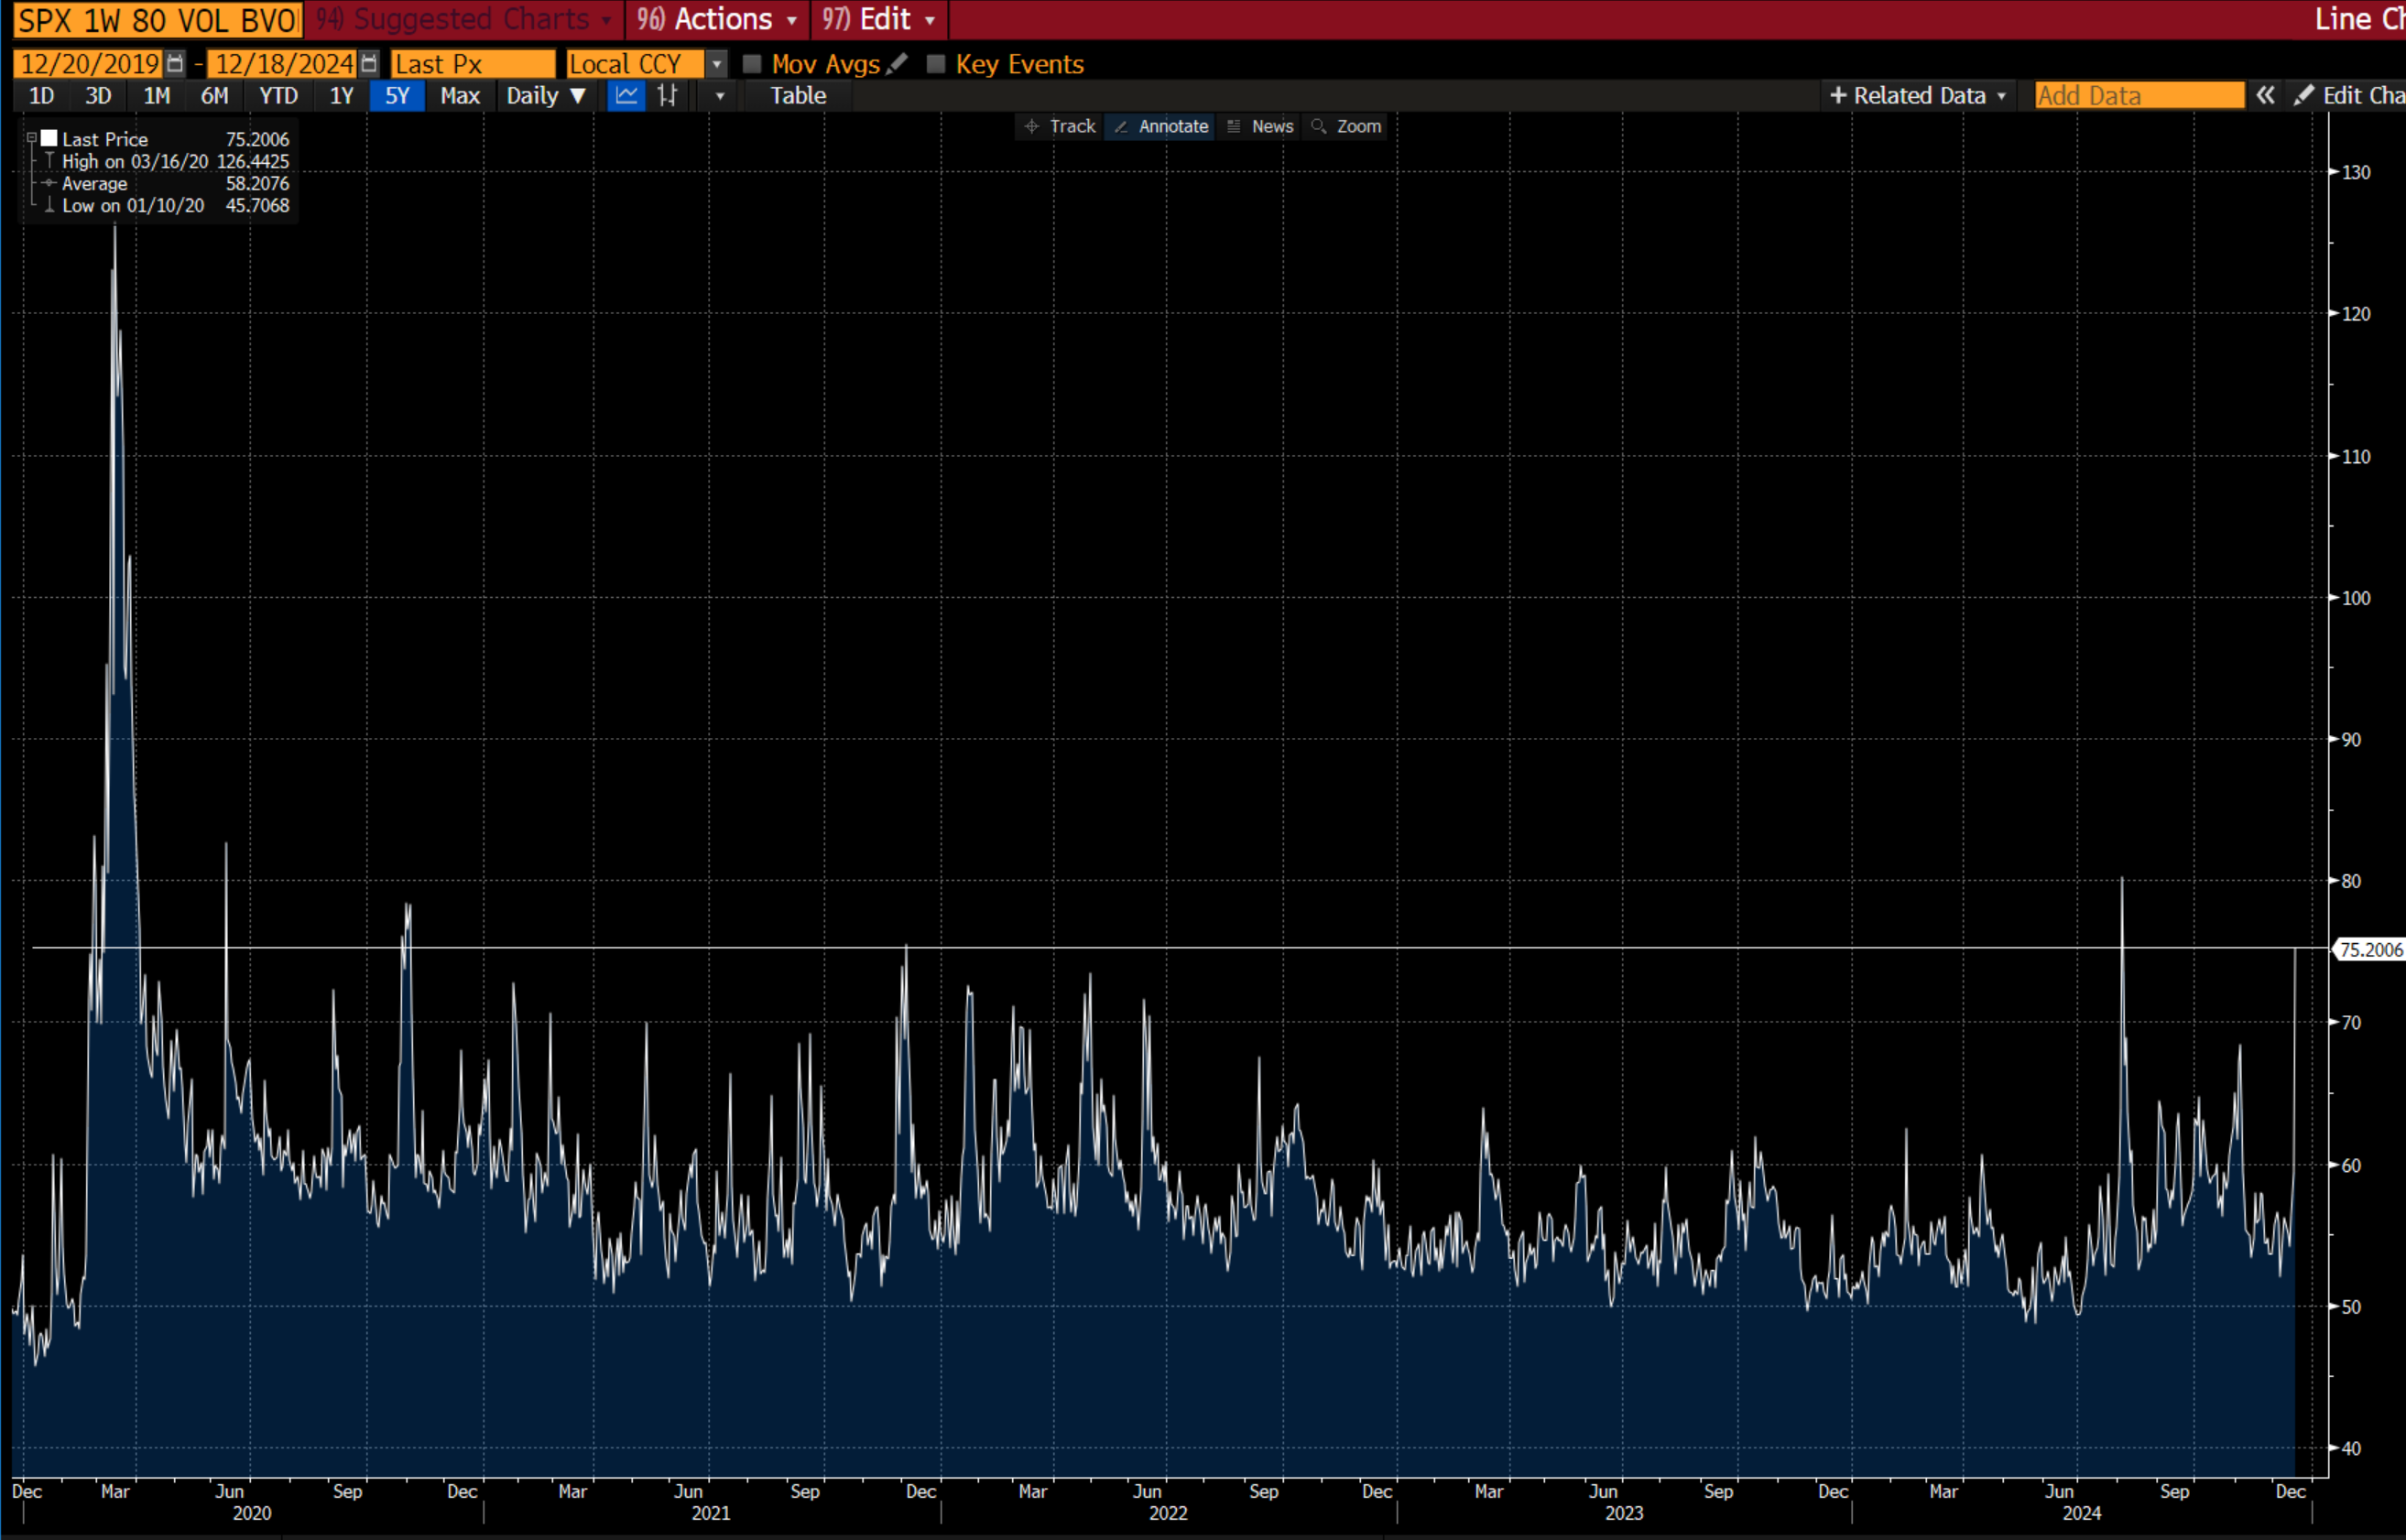
Look at the implied volatility of the 80% 1W SPX options implied volatility. We haven’t quite hit the Yen unwind levels but are among the highest spikes since 2020.
Interestingly, the other notable spike from 2021 was in December.
Most people seem to expect the sell-off to be over. I’m not as sure. We are in a low-liquidity period, with added Fed/economic uncertainty, and the dealer gamma no longer incentivizes them to hedge much.
Much more than at any other time since I started this substack, the markets will be the wild wild west for a bit.

Good luck out there.
Disclaimer: The information provided here is for general informational purposes only. It is not intended as financial advice. I am not a financial advisor, nor am I qualified to provide financial guidance. Please consult with a professional financial advisor before making any investment decisions. This content is shared from my personal perspective and experience only, and should not be considered professional financial investment advice. Make your own informed decisions and do not rely solely on the information presented here. The information is presented for educational reasons only. Investment positions listed in the newsletter may be exited or adjusted without notice.